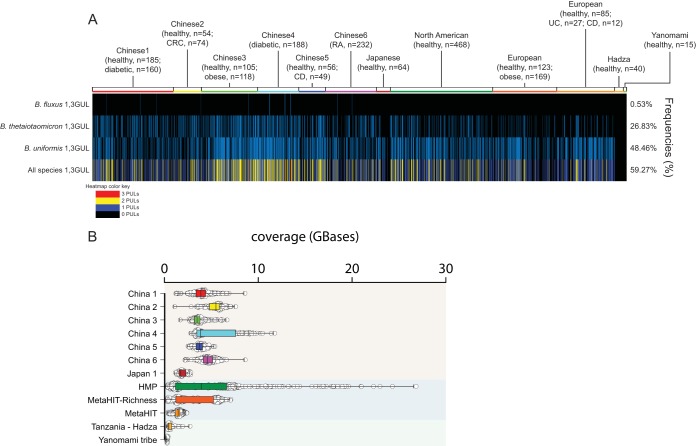
FIG 7.
Prevalence of 1,3-GULs in 2,441 human metagenomes. (A) Each line represents the presence (blue) or absence (black) of a specific 1,3GUL species related to a single human gut metagenomic sample. The bottom row represents the total number of 1,3GUL that each individual possesses, colored according to the legend. The frequency of 1,3GUL incidence across all 2,441 individuals is shown on the right. (B) Coverage variation of each metagenomic sample is indicated by individual samples (open circles) and a box plot with the mean.

