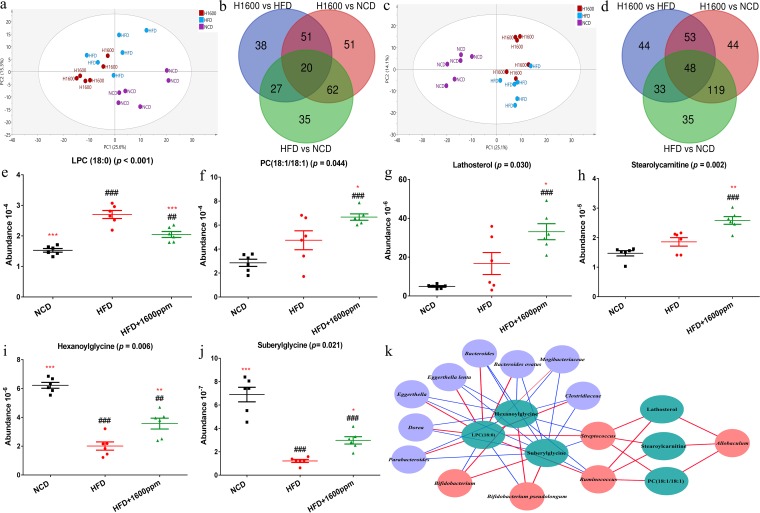
FIG 7.
Serum metabonomics analysis after GML supplementation. (a) PCA plot based on the metabolites detected in positive electrospray ionization (ESI+) mode. (b) Venn diagram of characterized metabolites in two groups’ comparisons in ESI+ mode. (c) PCA plot based on the metabolites detected in negative electrospray ionization (ESI−) mode. (d) Venn diagram of characterized metabolites in two groups’ comparisons in the ESI− mode. (e to j) Six serum lipid metabolites, including LPC(18:0) (e), PC(18:1/18:1) (f), lathosterol (g), stearoylcarnitine (h), hexanoylglycine (i), and suberylglycine (j), were significantly altered by GML treatment. (k) Correlation network between GML-induced significant changes in gut microbiotas at the genus and species levels and 6 significantly changed serum lipid metabolites (those for which P was <0.05 are represented, and detailed Spearman correlation indexes are listed in Table S3 in the supplemental material). (a to i) Six mice were tested. Data are expressed as means ± SEM. Values with asterisks and pound symbols are significantly different based on a one-way ANOVA with Tukey’s post hoc test (*, P < 0.05 versus HFD controls; **, P < 0.01 versus HFD controls; ***, P < 0.001 versus HFD controls; #, P < 0.05 versus NCD controls; ##, P < 0.01 versus NCD controls; ###, P < 0.001 versus NCD controls).

