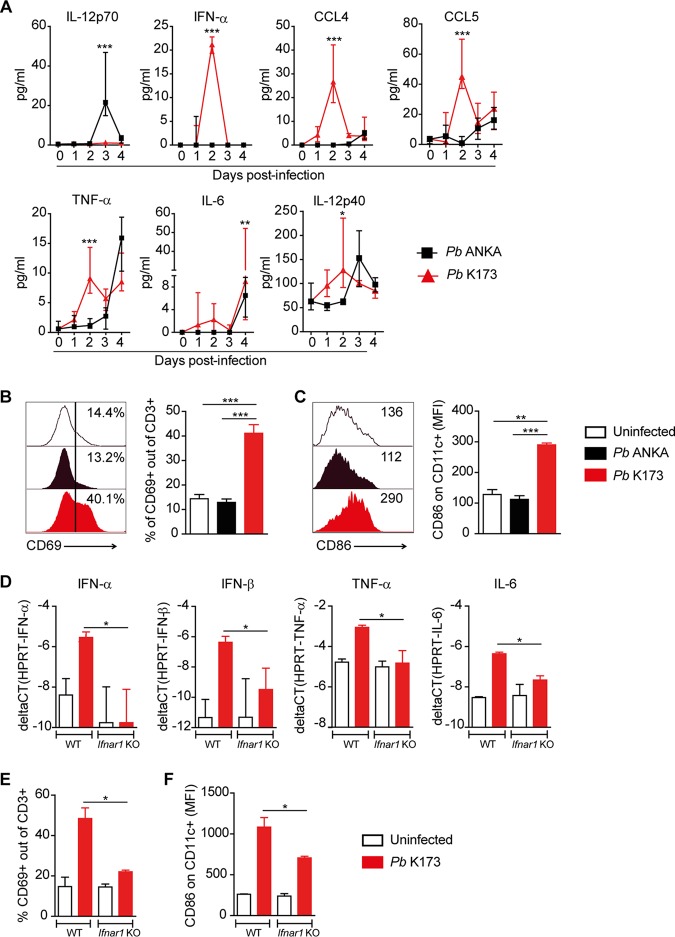
FIG 2.
P. berghei K173 but not P. berghei ANKA induces an early systemic type I IFN response. (A) Serum cytokines measured by Luminex assay at different time points after P. berghei (Pb) ANKA or P. berghei K173 infection. Proportions of CD69+ of CD3+ T cells (B) and geometric mean fluorescence intensities of CD86 expressed by CD11c+ cells (C) in the spleen at day 2 after infection. Bars show the medians ± IQRs. WT and Ifnar1 KO mice were infected with P. berghei K173 and analyzed at day 2 postinfection. (D) Cytokine gene expression in whole spleen analyzed by real-time qPCR. Proportions of CD69+ of CD3+ T cells (E) and geometric mean fluorescence intensities of CD86 on CD11c+ cells (F) in the spleen. Bars show the medians ± IQRs. (A, D, E, and F) Data from 1 experiment with 5 to 7 mice/group. (B and C) Data representative of 4 independent experiments with N = 4 mice/group.

