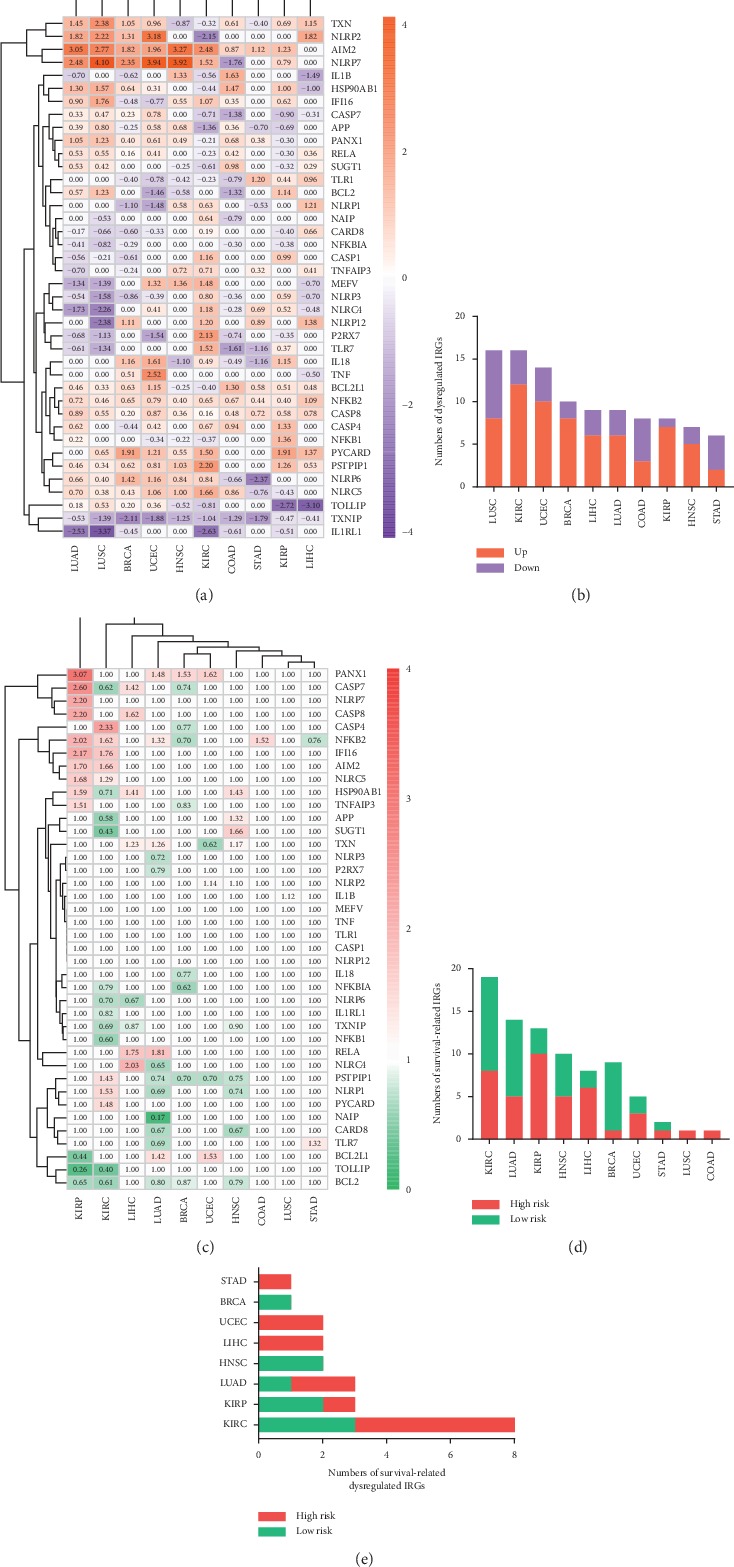
Figure 2.

(a) The expression patterns of IRGs across cancers on transcriptome level. Numerical value reflects log FC. (b) The numbers of dysregulated IRGs among 10 cancers. (c) The association between IRGs and prognosis of cancers. Numerical value indicates hazard ratio (HR). (d) The numbers of prognostic IRGs among 10 cancers. (e) The numbers of dysregulated IRGs associated with survival among 8 cancers.
