
Figure 5.
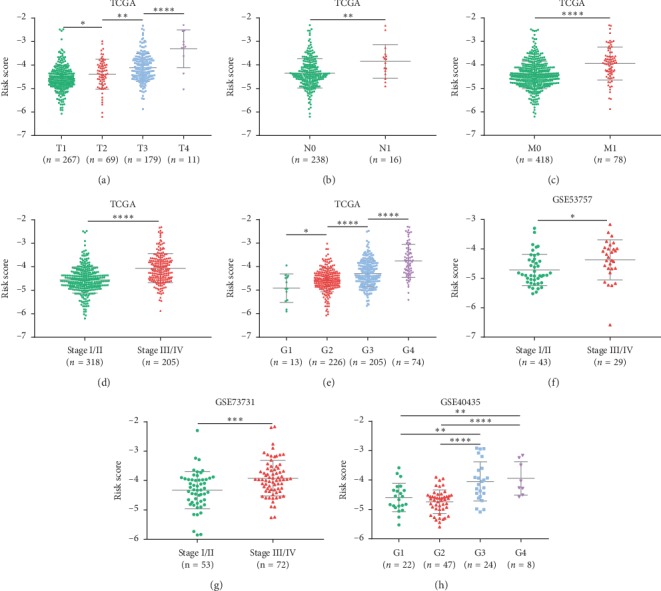
(a–e) Risk score distribution in the entire TCGA set by different T stages (a), N stages (b), M stages (c), TNM stages (d), and grades (e). Risk score distribution in the external validation sets by different stages (f-g) and grades (h).
Official websites use .gov
A
.gov website belongs to an official
government organization in the United States.
Secure .gov websites use HTTPS
A lock (
) or https:// means you've safely
connected to the .gov website. Share sensitive
information only on official, secure websites.
(a–e) Risk score distribution in the entire TCGA set by different T stages (a), N stages (b), M stages (c), TNM stages (d), and grades (e). Risk score distribution in the external validation sets by different stages (f-g) and grades (h).