Figure 6.

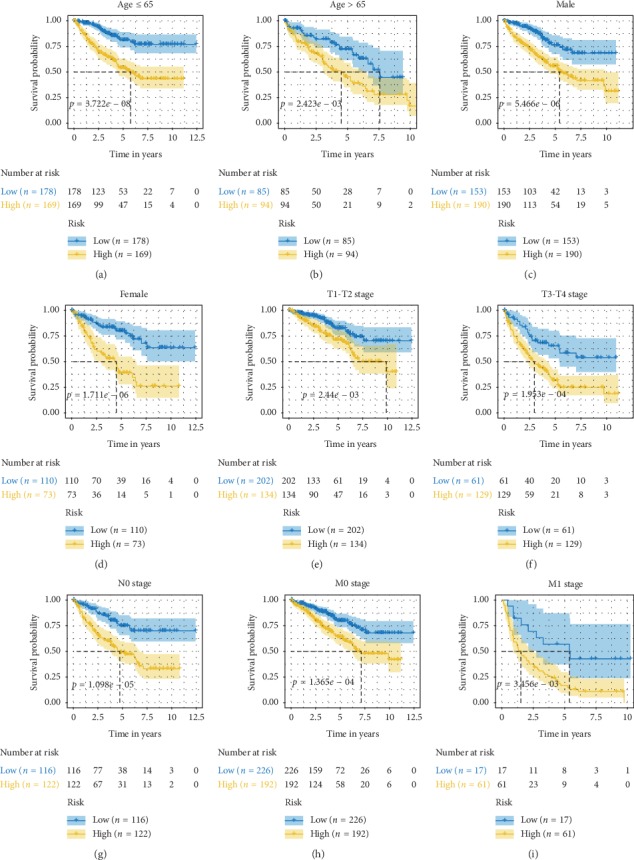
(a–i) Survival analyses of the IRGs signature in the TCGA cohorts stratified by age (a-b), gender (c-d), T stage (e-f), N stage (g), and M stage (h–i).

(a–i) Survival analyses of the IRGs signature in the TCGA cohorts stratified by age (a-b), gender (c-d), T stage (e-f), N stage (g), and M stage (h–i).