
Figure 7.
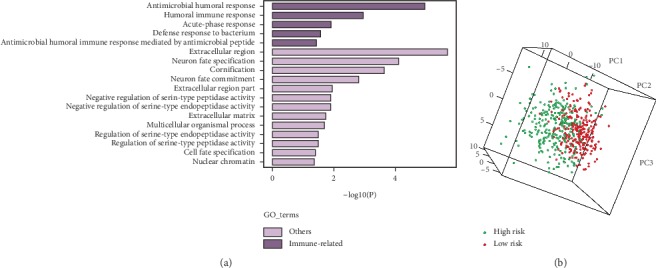
(a) GO analysis based on the upregulated genes (log FC > 2) in the high-risk group. (b) PCA analysis of the low- and high-risk groups based on immune-related genes in the entire TCGA cohort.
Official websites use .gov
A
.gov website belongs to an official
government organization in the United States.
Secure .gov websites use HTTPS
A lock (
) or https:// means you've safely
connected to the .gov website. Share sensitive
information only on official, secure websites.
(a) GO analysis based on the upregulated genes (log FC > 2) in the high-risk group. (b) PCA analysis of the low- and high-risk groups based on immune-related genes in the entire TCGA cohort.