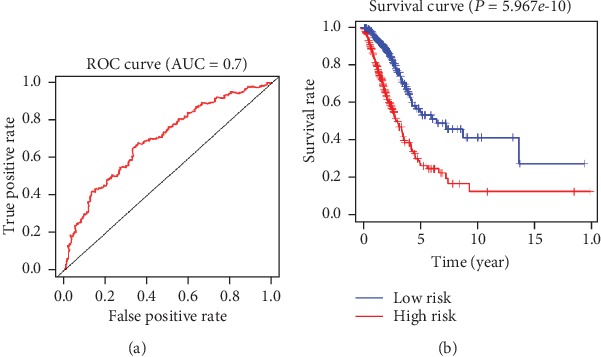
Figure 4.

The reliability of the model constructed by DEGs with independent prognostic factor values was validated. (a) The ROC curves of the risk model, where the vertical axis represents the true-positive rate and the horizontal axis represents the false-positive rate. (b) The survival curves of the high- and low-risk groups in the risk model, where the red line represents the high-risk group and the blue line represents the low-risk group.
