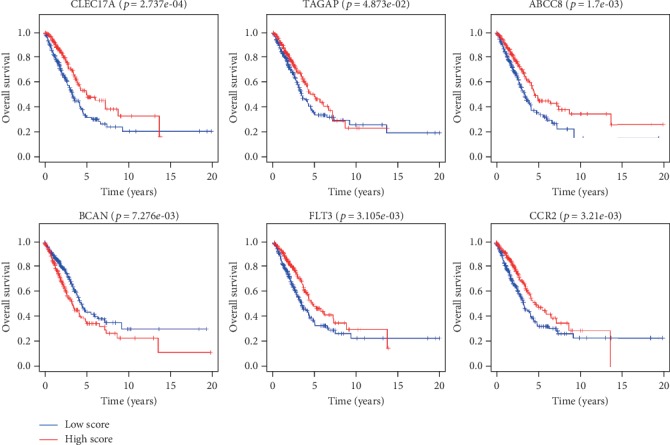
Figure 5.

Expression levels of 6 genes in the risk model were related to the prognosis of patients. Survival curves of the 6 genes (CLEC17A, TAGAP, ABCC8, BCAN, FLT3, and CCR2) expressions in the high-expression (red line) and low-expression (blue line) groups in the risk model on the prognosis of patients.
