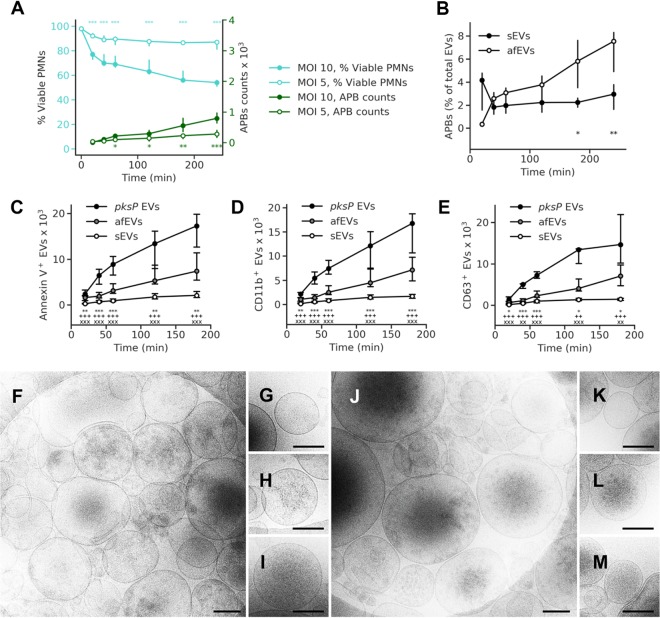
FIG 1.
A. fumigatus induces EV release by human neutrophils. (A) Time course of apoptotic body (APB) occurrence (green lines) and fungus-induced cell death (teal lines) at MOIs of 5 and 10 (n = 10 [15] and n = 12 [17] for apoptotic body counts for MOIs of 5 and 10, respectively; n = 4 [20] and n = 5 [15] for viability data for MOIs of 5 and MOI 10, respectively) (numbers in brackets are total number of technical replicates). (B) Percentage of apoptotic bodies per total number of EVs. (C to E) Time course of total EV release and the levels of the EV surface markers annexin V (n = 27 [40] for sEVs, n = 16 for afEVs and pksP EVs) (C), CD11b (n = 23 for sEVs, n = 16 for afEVs and pksP EVs) (D), and CD63 (n = 13 for sEVs, n = 9 for afEVs and pksP EVs) (E). sEVs were collected from uninfected cells. Symbols represent significant differences between pksP EVs and afEVs (*), pksP EVs and sEVs (+), afEVs and sEVs (x). The data in panels A and B to E are presented as the medians and interquartile ranges of the absolute numbers of EVs per 107 PMNs. P values were determined by the Mann-Whitney test. *, P < 0.05; **, ++, and xx, P < 0.01; *** and xxx, P < 0.001. (F to M) Cryo-TEM images of sEVs (F to I) and afEVs (J to M) at 2 h postinteraction. Representative images display sEVs (G to I) and afEVs (K to M) with different appearances. Bars, 200 nm.

