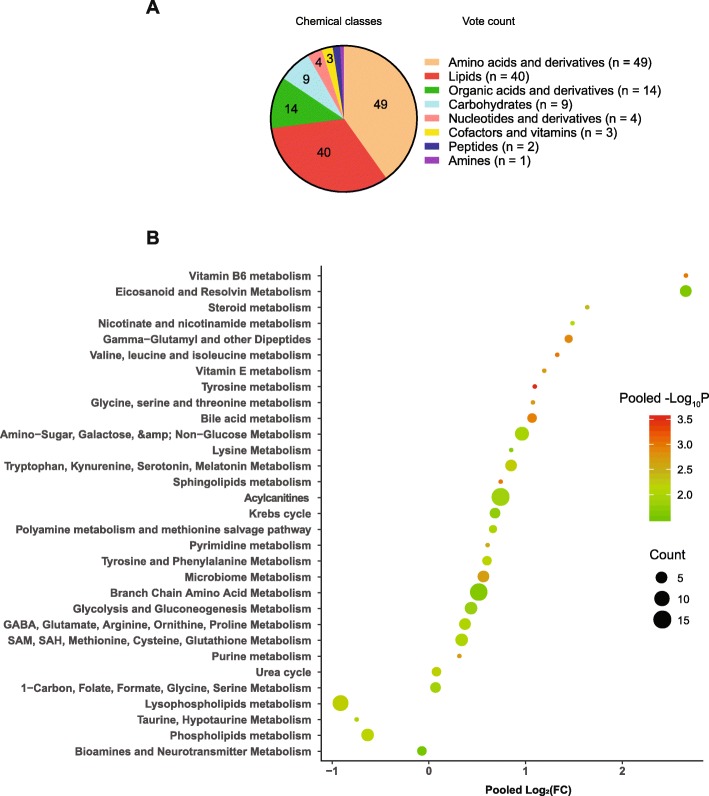
Fig. 2.
The vote count of the chemical classes for the differential metabolites between survivors and nonsurvivors (a) and the pooled fold changes (nonsurvivors/survivors), and P values for the dramatically altered metabolic pathways in sepsis nonsurvivors compared to the survivors (b). For the pie chart (a), the vote count indicated the frequency of a chemical class being identified as statistically different between sepsis nonsurvivors and survivors. For the volcano plot (b), a metabolic pathway was assigned to each differential metabolite. The pooled fold change and P value were calculated using random effects in the meta-analysis. We also added the vote-counting analysis to the volcano plot, which showed the frequency of a metabolic pathway being identified as statistically different between sepsis nonsurvivors and survivors. P < 0.05 was considered statistically significant

