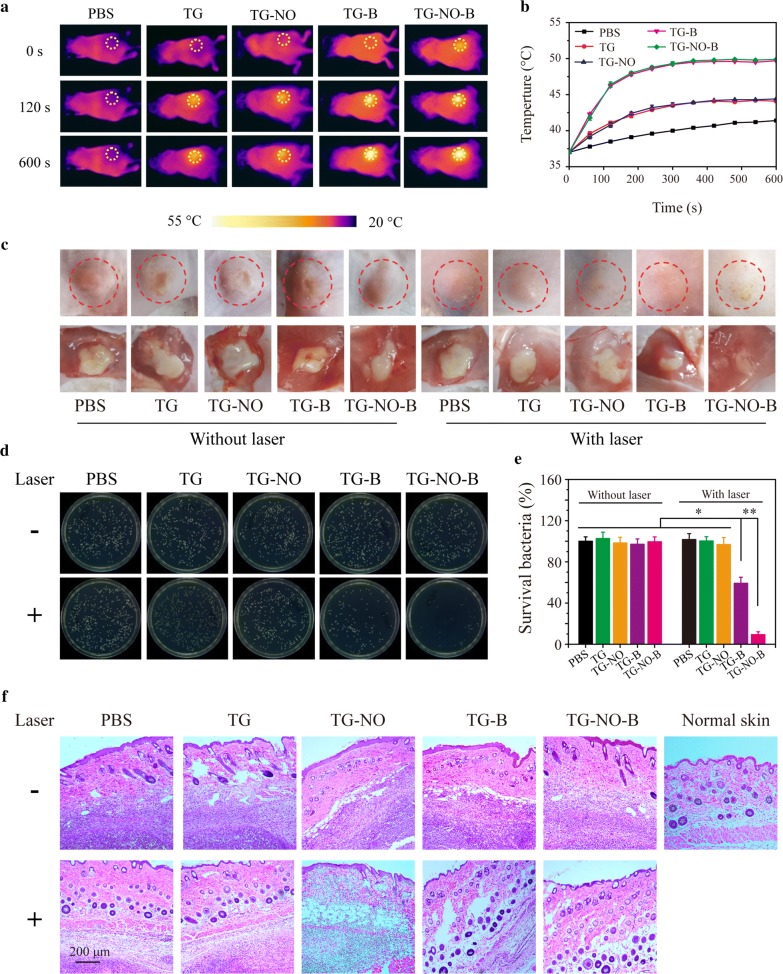
Fig. 10.
a Infrared thermography (0.75 W/cm2, 10 min) and b corresponding temperature curves of the mice bearing subcutaneous abscess after local injection of PBS, TG, TG-NO, TG-B and TG-NO-B at 6 h posttreatment. c Representative macroscopic appearances and biopsied photographs of the abscesses from the PBS, TG, TG-NO, TG-B, TG-NO-B, PBS + NIR, TG + NIR, TG-NO + NIR, TG-B + NIR and TG-NO-B + NIR groups after 12 days. d Representative photographs of bacterial CFUs and e corresponding quantitative results under various treatments. f Representative H&E staining images of abscesses that received various treatments

