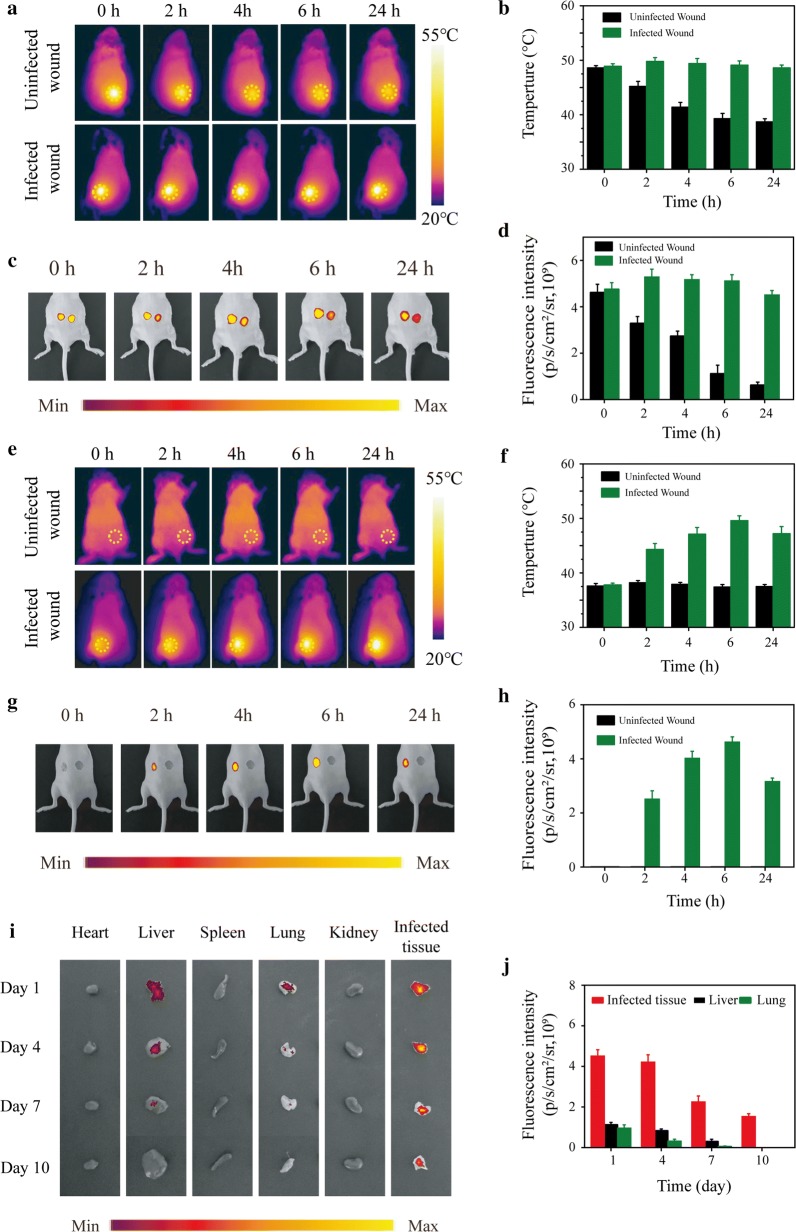
Fig. 8.
a Thermographic images, b the corresponding temperature measurements, c NIRF images and d the corresponding NIRF signal intensities of the mice with infected skin wounds after local injection of Cy5-TG-NO-B at 0, 2, 4, 6 and 24 h posttreatment. e thermographic images, f the corresponding temperature measurements, g NIRF images and h the corresponding NIRF signal intensities of the mice with infected skin wounds after intravenous injection of Cy5-TG-NO-B at 0, 2, 4, 6 and 24 h posttreatment. i NIRF images and the corresponding j NIRF signal intensities of the heart, liver, spleen, lung, kidney and the infected wound tissue extracted from the test mice intravenously injected with Cy5-TG-NO-B at the indicated time points (days 1, 4, 7, 10) postinjection

