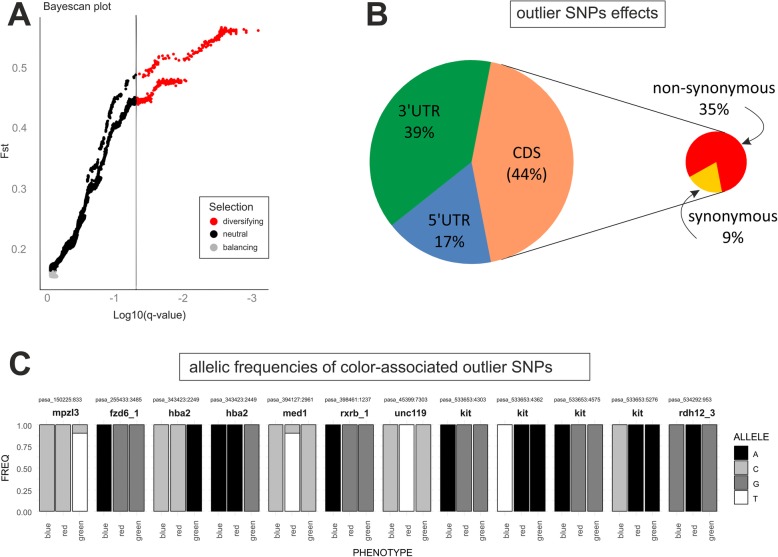
Fig. 3.
Signatures of selection on single-nucleotide polymorphisms (SNPs) in the transcriptome of Oophaga pumilio. A) Graphical results of the BayeScan analysis, the plot shows, for each of the 398,910 bi-allelic SNPs tested, the Fst between the three color phenotypes and their corresponding q-values (SNPs under diversifying selection, q < 0.05 and α > 0, are highlighted in red). B) Pie chart showing the positions and predicted effects of the 370 outlier SNPs detected in the BayeScan analysis. C) Allelic frequencies of the outlier SNPs occurring in color-associated genes, each bar chart shows the frequency of alleles in each population

