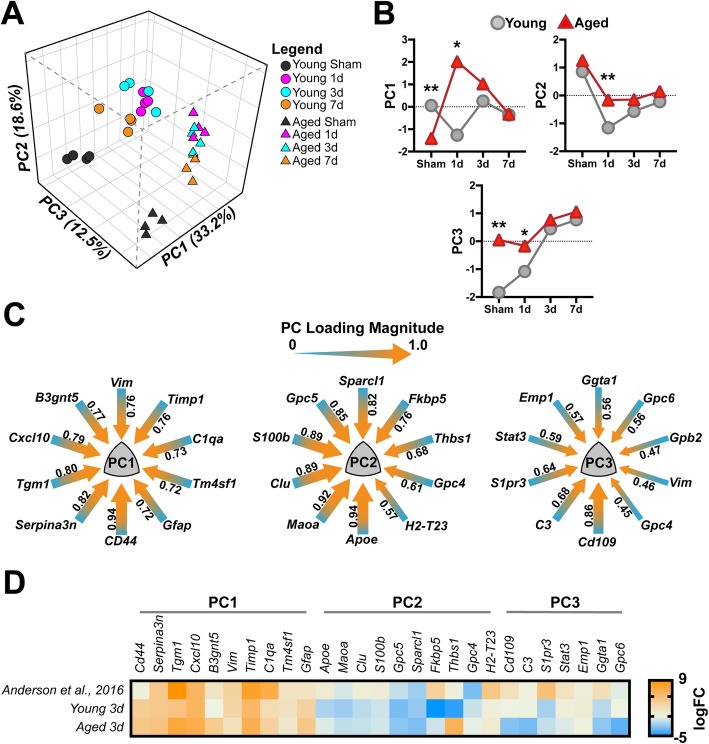
Fig. 7.
Astrocyte-specific response patterns to age and TBI revealed by principal components analysis (PCA). a Multivariate dimensional reduction by PCA uncovered 3 orthogonal PC groups that cumulatively accounted for 64.3% of the total variance. Within this multidimensional space, PC1 (33.2% variance) reflected a primarily TBI-induced response, while PC2 (18.6% variance) reflected some of the temporal responses within the dataset, and lastly PC3 (12.5% variance) reflected an age-related effect. b Temporal trajectories of the mean PC score for each group in each of the three PCs identified. Data were analyzed using two-way ANOVA with Sidak-Holm correction for examining pairwise interactions for each time interval. Data points represent the mean PC score for each interval and age. Young, gray circles; Aged, red triangles. c PC loading magnitudes for the top 10 genes > |.45| loading for each of the three PCs. Arrow gauge (thickness) is proportional to loading magnitude, with heat (color) representing loading directionality toward 1.0. d Comparison of the log2 fold change (logFC) from “SCI WT Astrocyte” vs. “Uninjured WT Astrocytes” from Anderson et al. versus mean logFC of young 3-day and aged 3-day cohorts from the current study. Comparing 3-day TBI responses from both young and aged cohorts with SCI-induced responses reveals a striking similarity in PC1-related profiles between the two datasets. Data were arranged within the previously defined PCs from above; duplicates of genes from PCs (e.g., PC1 Vim) were removed for clarity. Additionally, no data were found in the Anderson et al. dataset for Gpb2, which was also removed for clarity

