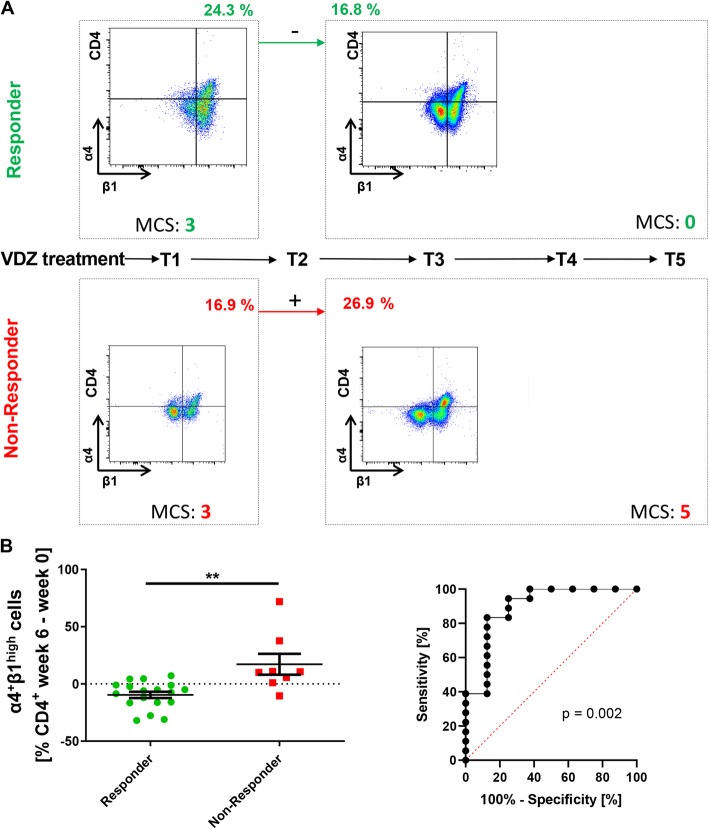
Fig. 3.
Dynamic expression of α4β1 integrin on CD4+ T cells in the peripheral blood of patients with UC treated with vedolizumab. a Timeline of vedolizumab treatment (T1–5) with representative flow cytometry and clinical data. Flow cytometry of integrin expression on CD4+ T-cells in the peripheral blood was performed before T1 and T3. Clinical response was determined at T5. Representative flow cytometric and clinical data from a responder to vedolizumab (upper panels) and a non-responder to vedolizumab (lower panels) are shown. b Left panel: Difference in the expression of α4β1 integrin on CD4+ T cells in the peripheral blood between week 0 (T0) and week 6 (T3) of vedolizumab treatment as determined by flow cytometry (n = 26; 18 responders, 8 non-responders). Statistical comparison with two-tailed Mann-Whitney test. Right panel: Receiver-operator-characteristic (ROC) analysis for prediction of clinical response to vedolizumab treatment by changes in α4β1 expression between week 0 and week 6. Significance level (left) and p-value (right) are indicated. MCS – Mayo clinical subscore

