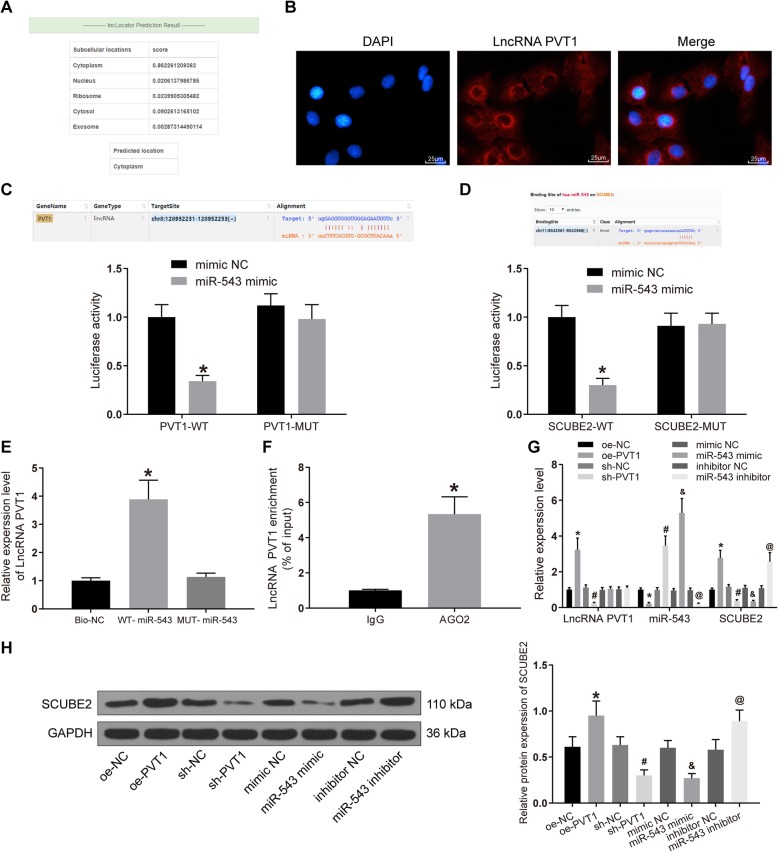
Fig. 4.
PVT1 interacts with miR-543 in RA-FLSs to promote SCUBE2 expression. a The PVT1 localization in cytoplasm predicted by LncLocator. b Localization of PVT1 in FLSs of RA by FISH (× 100). c The binding relationship between PVT1 and miR-543 verified by dual luciferase reporter gene assay, *p < 0.05 vs. the mimic NC group. d The binding relationship between SCUBE2 and miR-543 verified by dual luciferase reporter gene assay, *p < 0.05 vs. the mimic NC group. e The binding relationship between PVT1 and miR-543 verified by the RNA pull-down assay, *p < 0.05 vs. the Bio-NC group. f PVT1 is enriched by AGO2 verified by RIP, *p < 0.05 vs. the IgG group. g PVT1 and miR-543 expression and the mRNA expression of SCUBE2 in each group was detected by RT-qPCR, *p < 0.05 vs. the oe-NC group, #p < 0.05 vs. the sh-NC group, &p < 0.05 vs. the mimic NC group, @p < 0.05 vs. the inhibitor NC group. h The protein expression of SCUBE2 in each group was detected by western blot analysis, *p < 0.05 vs. the oe-NC group, #p < 0.05 vs. the sh-NC group, &p < 0.05 vs. the mimic NC group, @p < 0.05 vs. the inhibitor NC group. All data were measurement data and presented as mean ± standard derivation. The ANOVA was used for the comparison among multi-groups, of which comparing between two groups adopted Tukey’s post hoc test; the experimental data was obtained from the average of 3 independent experiments

