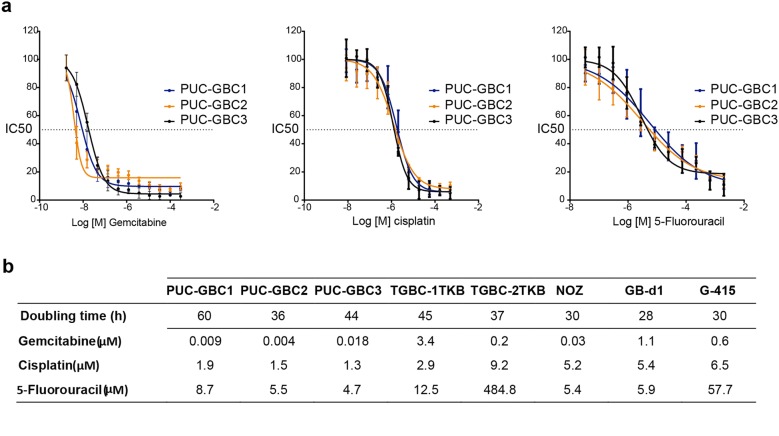
Fig. 6.
Growth characteristics and chemosensitivity analysis. a Dose–response curves of the ascites-derived gallbladder cancer cell lines treated with chemotherapeutic agents. Cells were incubated for 72 h with each drug as single agent before cell viability was assessed via MTS assay. Data are representative of three independent experiments with three technical replicates (mean ± SD) b Mean doubling times (hours) and half maximal inhibitory concentration (IC50) values of cytotoxic drugs of ascites-derived clones and commercial established GBC cell lines

