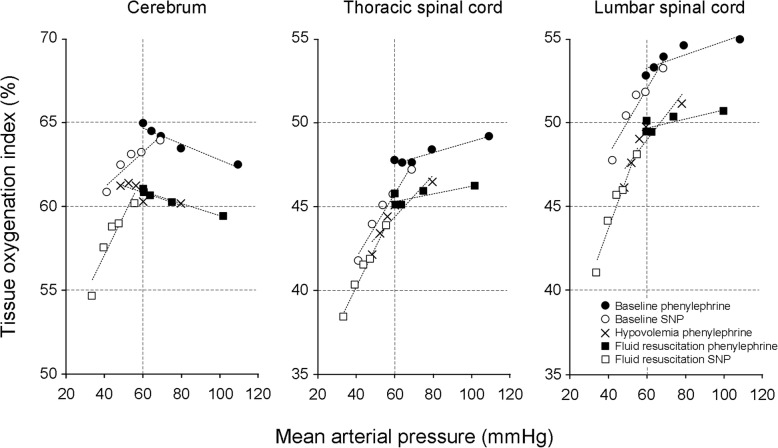
Fig. 3.
Relationship between the mean arterial pressure and each tissue oxygenation index. The linear regression lines for the cerebrum, thoracic spinal cord, and lumbar spinal cord data, respectively, are y = − 0.05x + 68 (R2 = 0.95), y = 0.03x + 46 (R2 = 0.94), and y = 0.04x + 51 (R2 = 0.78) during phenylephrine infusion under baseline conditions; y = 0.10x + 57 (R2 = 0.89), y = 0.19x + 34 (R2 = 0.97), and y = 0.20x + 40 (R2 = 0.91) during sodium nitroprusside (SNP) infusion under baseline conditions; y = − 0.04x + 63 (R2 = 0.67), y = 0.12x + 37 (R2 = 0.87), and y = 0.15x + 40 (R2 = 0.82) during phenylephrine infusion under hypovolemia; y = − 0.04x + 63 (R2 = 0.97), y = 0.02x + 44 (R2 = 0.60), and y = 0.03x + 48 (R2 = 0.65) during phenylephrine infusion under fluid resuscitation; and y = 0.24x + 48 (R2 = 0.88), y = 0.24x + 31 (R2 = 0.98), and y = 0.32x + 31 (R2 = 0.95) during SNP infusion under fluid resuscitation

