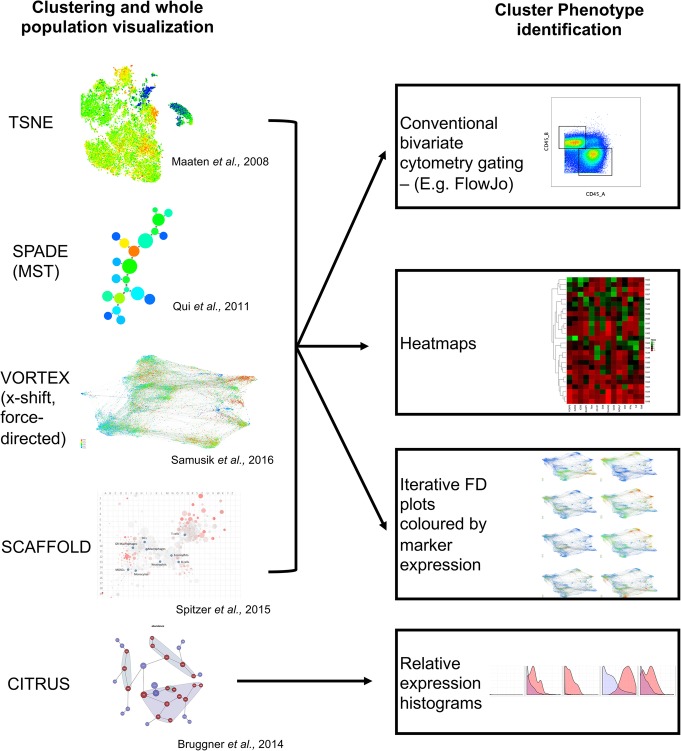
Fig. 1.
Current approaches to analyse mass cytometry data. (Left) 5 examples of commonly used approaches for visualising mass cytometry data. tSNE or viSNE, SPADE or other minimum spanning tree (MST) approaches, x-Shift clustering in the VorteX application and subsequent force-directed layout, SCAFFoLD and CITRUS. (Right) Downstream approaches to determining cluster/subset phenotype. Conventional cytometry analysis, heatmaps, iterative plotting of visualisation coloured by a single marker and relative expression histograms. Most visualisation techniques allow for downstream processing using any of the listed techniques, CITRUS is more restricted to built-in outputs

