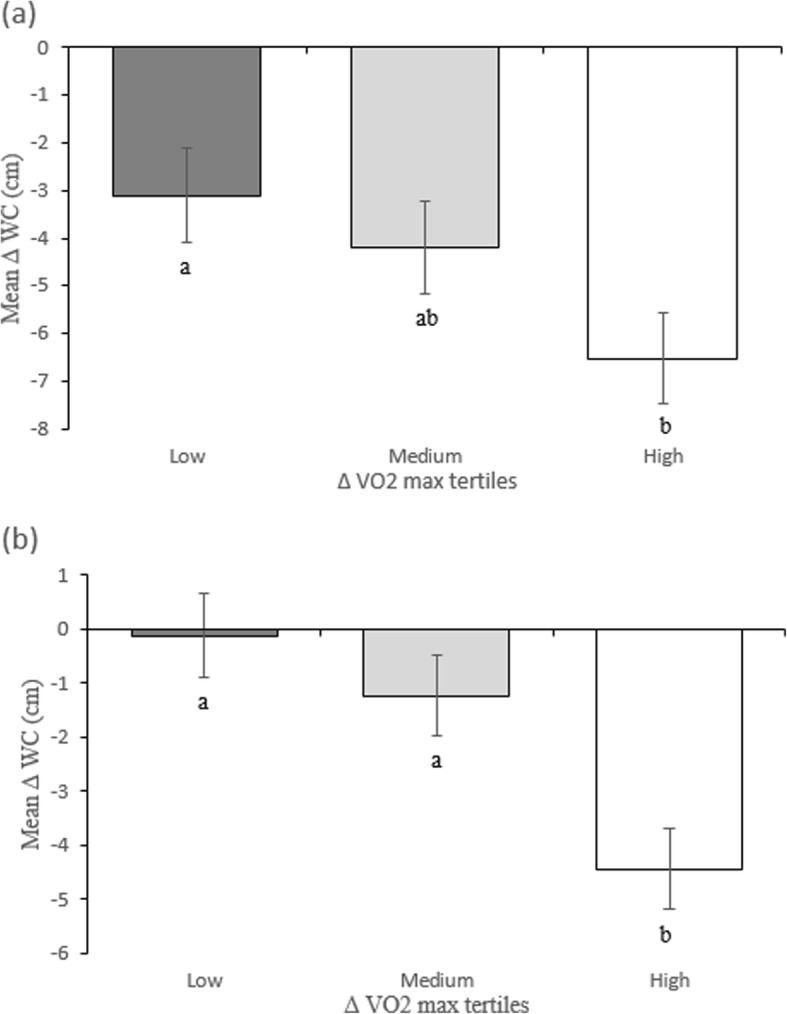
Fig. 1.

Mean changes in waist circumference (WC) between baseline and month 12 (Panel a) and mean changes in waist circumference (WC) between month 3 and month 12 (Panel b) for women according to changes in VO2 max tertiles. Panel A: ∆VO2max values were 0.24 (0.24), 2.80 (0.11), and 7.24 (0.56) (Mean ± SE) ml.kg-1.min− 1 for the low, medium and high tertiles, respectively. Panel B: Corresponding ∆VO2max values were − 1.48 (0.33), 0.54 (0.06), and 3.13 (0.35). Values within the same panel with different superscript letters (a,b) are significantly different (P < 0.05, Tukey-Kramer post hoc)
