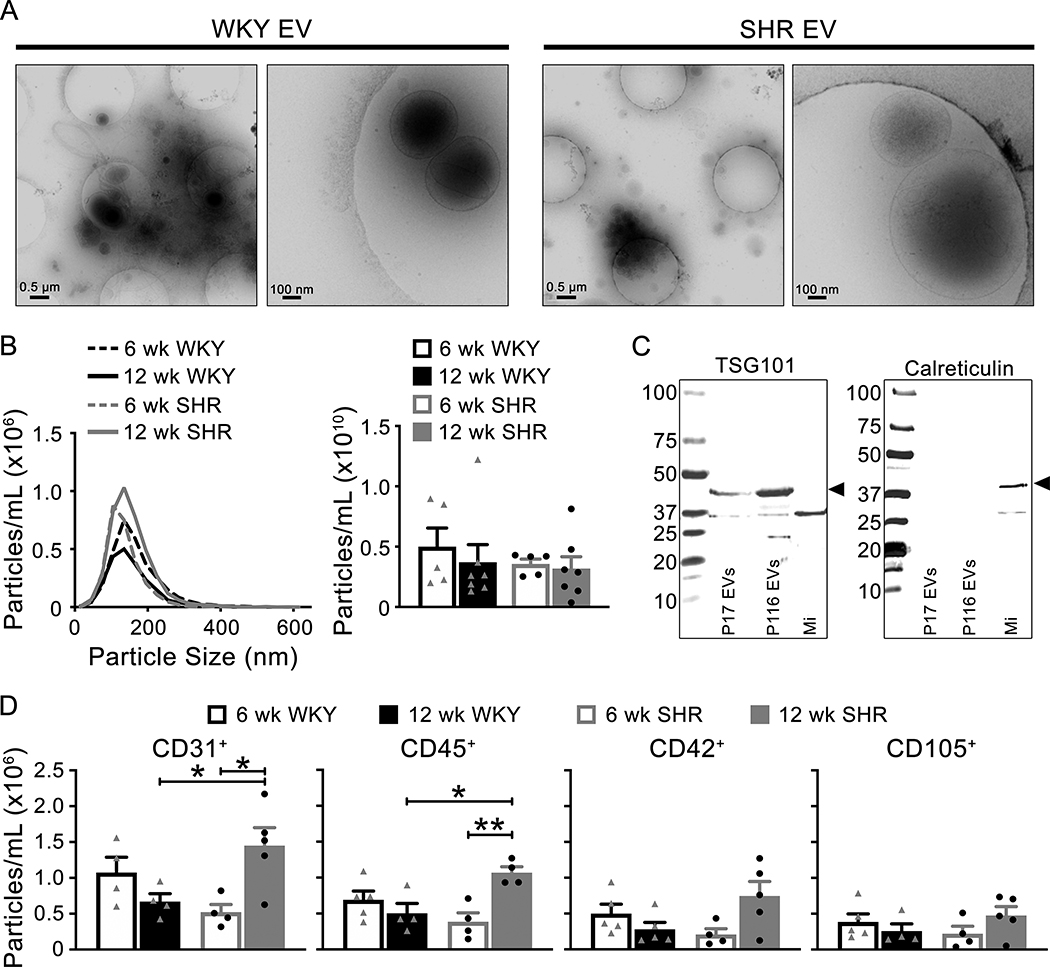
Figure 1: Characterization of EV morphology, size, concentration and protein cargo.
(A) Cryo-electron microscopy images show EVs of different sizes (<100nm to 1000nm) from 12 week old WKY and SHR (low magnification (left panel) and high magnification (right panel) images). (B) EV size distribution and concentration were not different between age and genotypes of animals using NTA (WKY: triangle symbols; SHR: circle symbols). (C) Western blots of known EV protein (TSG101) and non-EV protein (Calreticulin) was performed on EV pellets (P17 and P116 are EV containing samples, while a crude microsome membrane preparation (Mi) was used as a positive control for calreticulin). (D) Summarized targeted phenotyping data of EVs from WKY (triangle symbols) and SHR (circle symbols) using the following markers: CD31, CD45, CD42, and CD105. Hypertension resulted in a significant increase in CD31 and CD45 positive EVs. Data are presented as mean ± sem. One-way ANOVA: * p < 0.05, ** p < 0.01.

