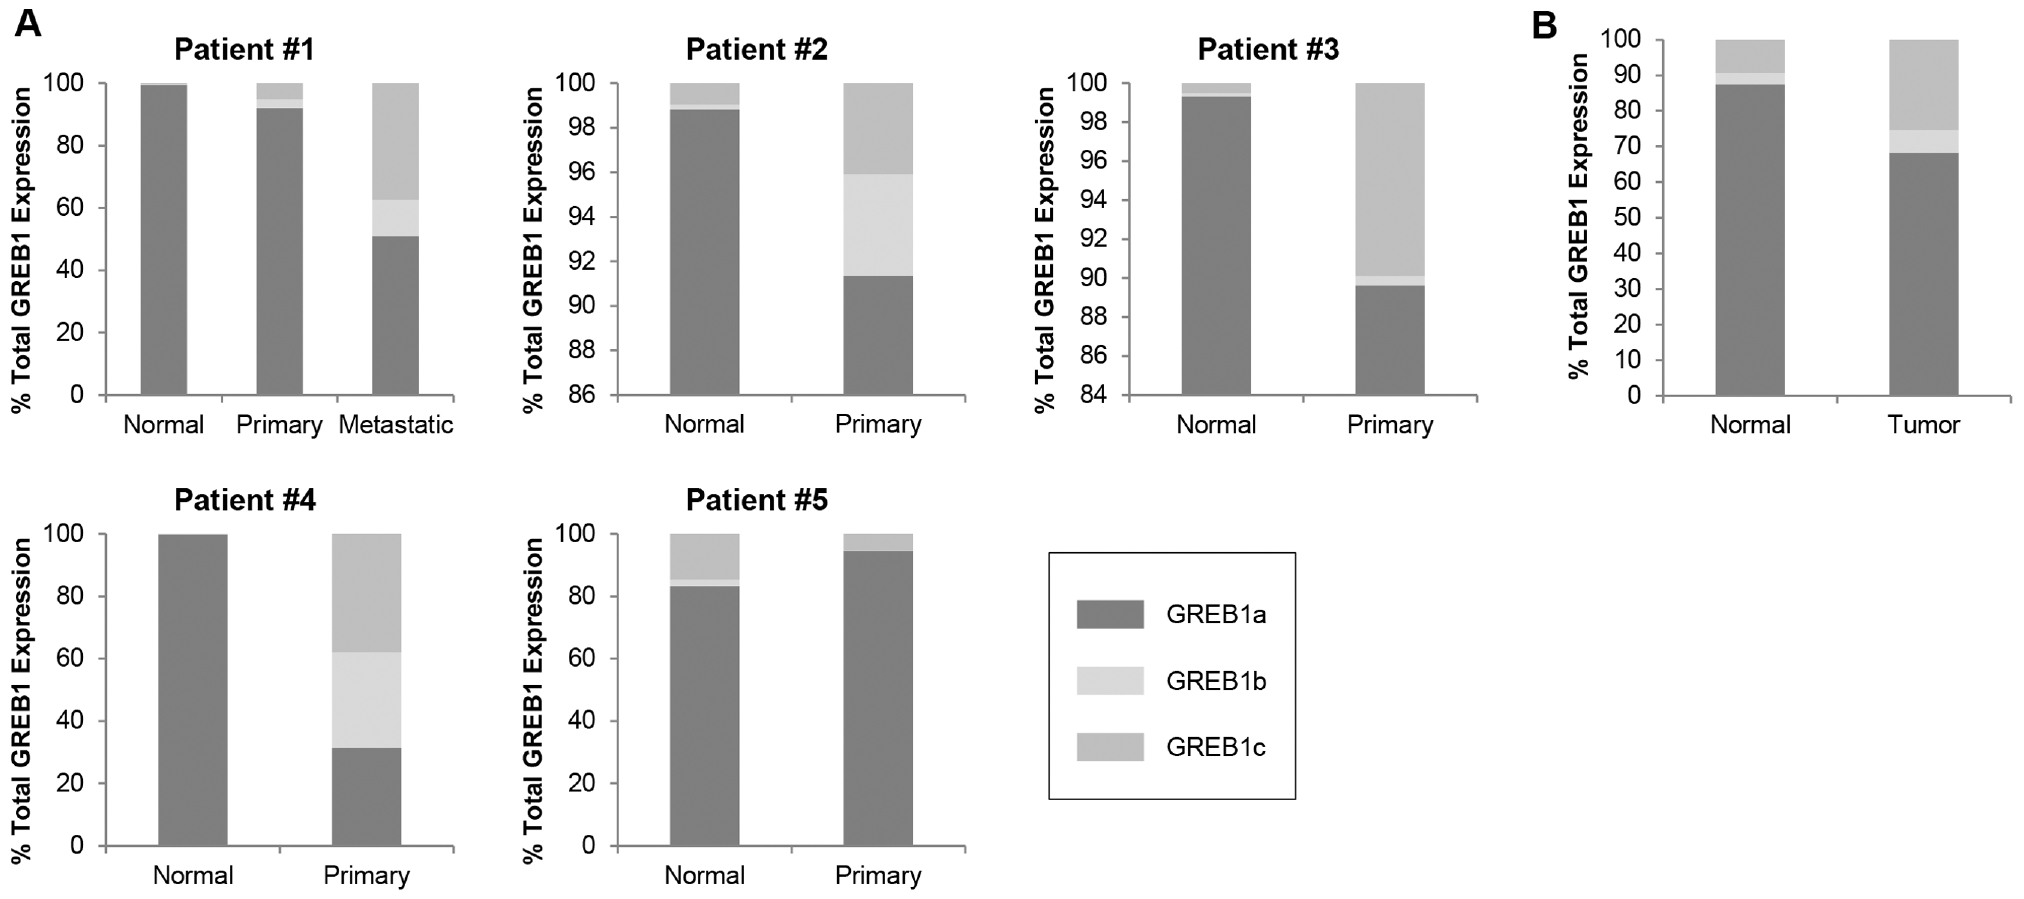
Figure 6.

Expression of GREB1b and GREB1c is higher in malignant tissue. (A) Absolute mRNA copy number was determined from a standard curve generated using Taqman probes for GREB1a, GREB1b and GREB1c in patient-matched normal and tumor tissue samples. The percentage of total GREB1 expression of each isoform was compared between normal and primary or metastatic tissue from each patient using the Kruskal–Wallis multiple comparison method. The percent of GREB1b and GREB1c expression is significantly higher in primary tumor tissue in four of the five matched patient samples (P ≤ 0.05). (B) GREB1a, GREB1b and GREB1c transcript expression was generated from a publically available dataset of normal and tumor tissue from breast cancer patients (Varley et al. 2014, Li et al. 2016). The percentage of total GREB1 expression of each isoform was compared between normal and tumor samples using differential expression analysis (Li et al. 2016). Expression of GREB1b and GREB1c is significantly higher in tumor tissue than in normal tissue (P ≤ 0.005).
