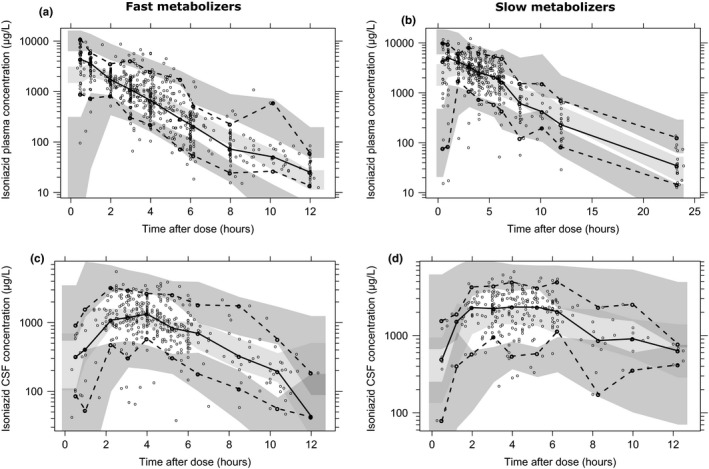
Figure 2.

Visual predictive check of the final population pharmacokinetic model for isoniazid plasma and CSF concentration in (a, c) fast and (b, d) slow metabolizers based on 1,000 stochastic simulations. Open circles represent the observations, and solid lines represent the 5th, 50th, and 95th percentiles of the observed data. The shaded areas represent the 95% confidence intervals around the simulated 5th, 50th, and 95th percentiles. CSF, cerebrospinal fluid.
