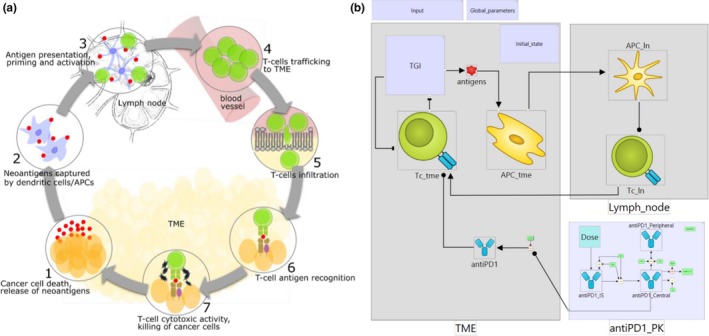
Figure 2.

Minimal Cancer Immunity Cycle (CIC) model. (a) Schematic representation of the CIC. (b) Biological process map of the minimal CIC model. TME, lymph_node, tumor microenvironment (TME) and lymph node compartments; TGI, tumor growth inhibition module; antigens, cancer neoantigens; antigen‐presenting cell (APC)_tme, APC_ln, antigen‐presenting cells in the TME and lymph node compartments; Tc_ln, Tc_tme, cytotoxic T‐cells in the lymph node and TME compartments; anti‐PD1_IS, anti‐PD1_Central, anti‐PD1_Peripheral, anti‐PD1, variables of the pharmacokinetic (PK) model representing anti‐PD1 antibody in injection site, central, peripheral, and TME compartments. The map shows modules enclosing model variables, rate laws, and parameters. A detailed map with expanded modules is available in the Supplementary Material.
