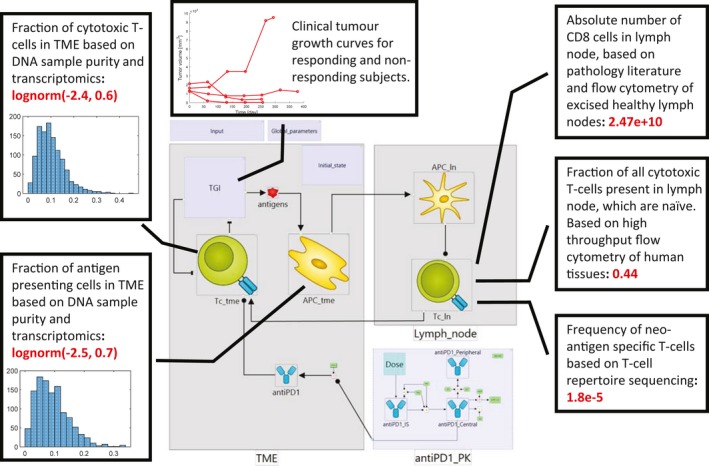
Figure 3.

Example integration of omics and clinical biomarker data. Figure shows the constraints on state variables in a minimal Cancer Immunity Cycle model based on omics data. Baseline, log‐normal distributions of the fractions of cytotoxic T‐cells and antigen presenting cells were derived from Immune Landscape of Cancer data. Insets show histograms of cell frequencies inferred from genomes and transcriptomes of individual lung cancer biopsies (N = 1156). The baseline number of neo‐antigen specific T‐cells was calculated based on data from high‐throughput flow cytometry of human tissues, T‐cell repertoire sequencing, and the established literature of basic cellular composition of the immune system. Mechanistic model allows integration of these diverse datasets with longitudinal measurements of clinical biomarkers (tumor growth). APC, antigen‐presenting cell; PK, pharmacokinetic; TGI, tumor growth inhibition; TME, tumor microenvironment.
