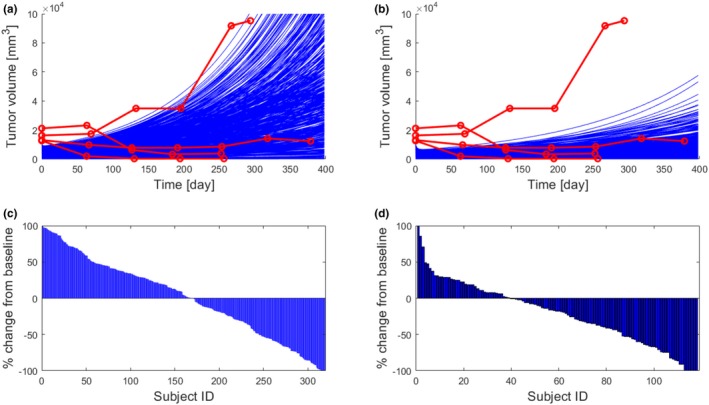
Figure 4.

Virtual trial simulation. Four hundred eighty‐nine virtual subjects were generated by randomly varying selected model inputs. (a, b) Comparison of tumor growth curves with clinical data for a untreated subjects and b subjects treated with 19 doses of 10 mg/kg anti‐PD1 pembrolizumab administered every 3 weeks. Simulated data are plotted in blue for all subjects. Red lines and symbols show four treated clinical subjects, and three showing response to therapy. A nonresponding subject was assumed to represent an untreated tumor. (c) Simulated % change of final tumor size from baseline for each simulated subject (sorted in descending order; waterfall plot). Virtual subjects whose tumor doubled in size were removed from the trial (dropout rate 35%). (d) A waterfall plot from the KEYNOTE‐001 clinical study.12
