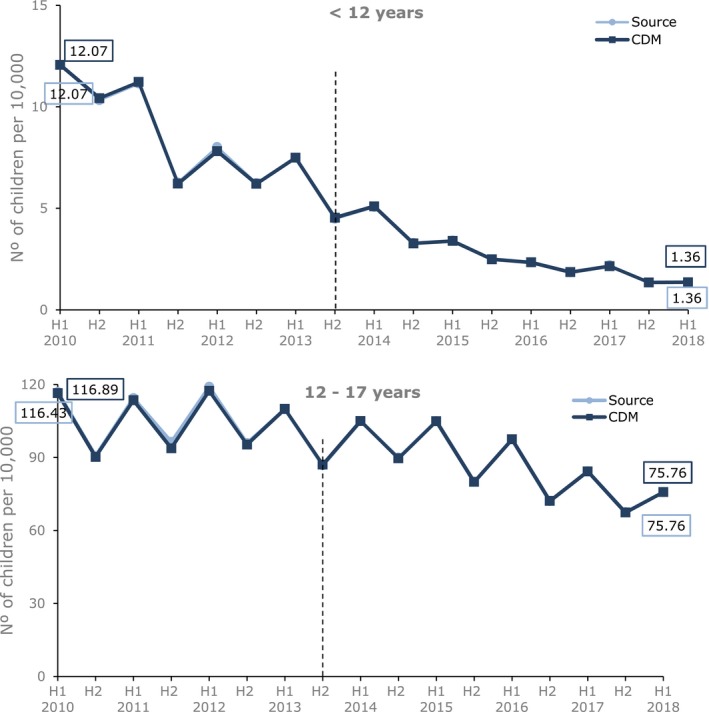
Figure 5.

Six‐monthly prevalence (per 10,000) of codeine prescribing for pain in children 0–17 years by age group in IQVIA Medical Research Data (IMRD)‐UK source vs. IMRD‐UK Observational Medical Outcome Partnership common data model (CDM; database version 1809). The black vertical line represents the date of introducing the risk minimization measures. The x‐axis shows the half year (H1 = January 1 to June 30, H2 = July 1 to December 31). [Colour figure can be viewed at http://wileyonlinelibrary.com]
