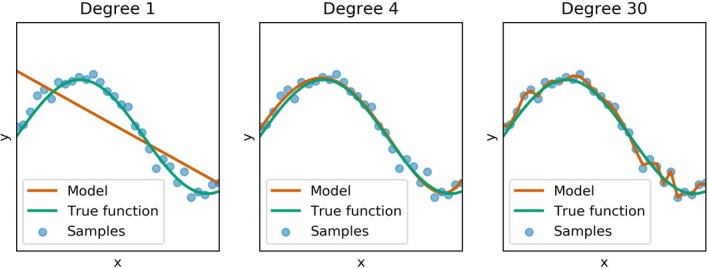
Figure 2.

Illustration of the problem of underfitting and overfitting based on a polynomial regression. Different models (red curves) are fit to a set of noisy samples (blue points) from the function y = sin(5x) (green curve). Each subplot present the results from a regression model of degree n (i.e., a model f(x) = β0 + β1 x 1 + β2 x 2 + … + βnxn with scalar regression coefficients β0, …, βn). Underfitting (left subplot) occurs when the model has too little capacity to capture the complexity of the data, whereas overfitting (right subplot) fits the data points well, but is unlikely to generalize well to new samples from the underlying function. The central subplot shows a fit that is “just right” in that it closely approximates the true function given a set of samples.
