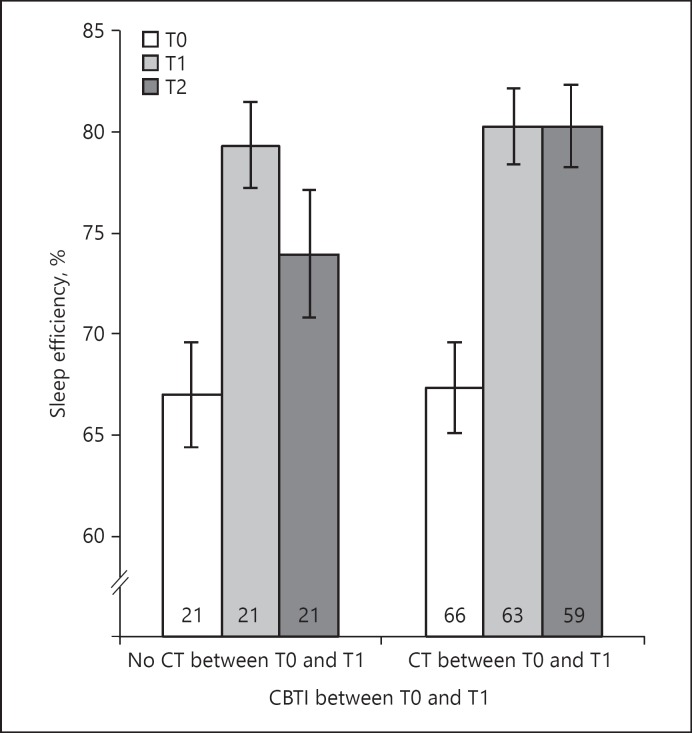
Fig. 1.
Sleep efficiency at T0, T1, and T2 for participants who received ICBTI between T0 and T1, both without CT (left) and combined with CT (right). Bars show sleep efficiency at baseline (T0, white), week 5 (T1, light gray), and week 10 (T2, dark gray) for the groups that received ICBTI in weeks 1–4 (between T0 and T1) either without CT (3 bars on the left-hand side) or with CT (3 bars on the right-hand side). Numbers in bars indicate the sample size of participants included in each condition at each time point. Light gray bars show little effect of adding CT on sleep efficiency immediately after CBTI. Comparison of the dark gray bars shows that valuable effects of adding CT emerge only at the follow-up: CT promotes maintenance of the initial sleep efficiency response to ICBTI.

