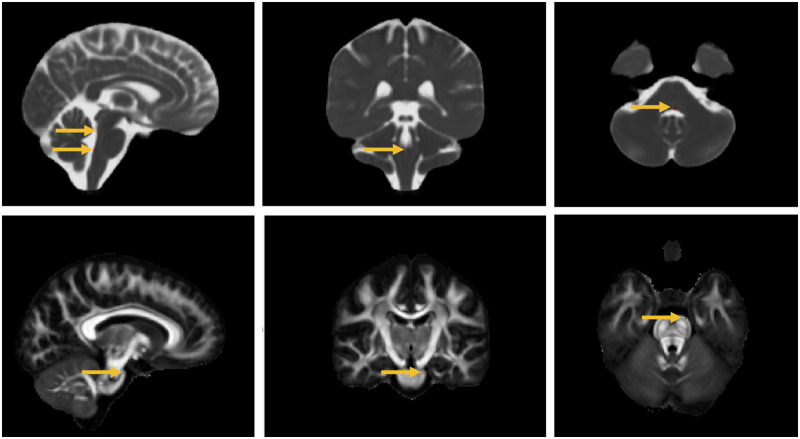
Figure 4.
Differences in diffusion metrics in subjects with MBS compared to HC. A few voxels (indicated by the arrows) are areas of significant increase in MD (top) and decrease in FA (bottom) in subjects with MBS compared to HC (FWE corrected P < 0.01) superimposed on the MD and FA maps, respectively.

