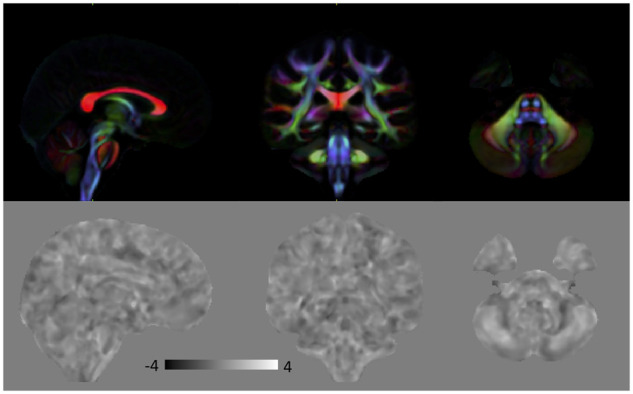
Figure 6.

Top: Directionally encoded color (DEC) map for anatomical reference. Bottom: Effect size of lnJ maps comparing iCFW subjects to HC. Dark areas indicate regions that are smaller in iCFW subjects, whereas bright areas indicate areas that are larger in these subjects. There are no regions of significant volumetric difference between iCFW subjects and HC. In the effect size map, black corresponds to −4, white to +4 and the grey background is equal to 0.
