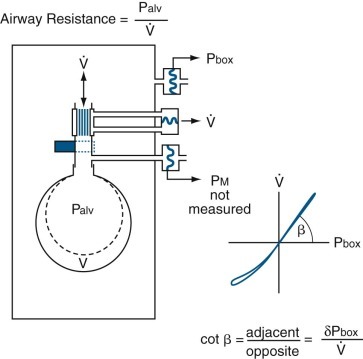
Figure 25-13.

Measurement of airway resistance by plethysmography.
The rectangle represents a closed, constant-volume, variable-pressure, whole-body plethysmograph, as in eFig. 25-5. The subject is represented by a single alveolus and its conducting airway. The top pressure transducer measures pressure within the plethysmograph, or box pressure (Pbox). The middle pressure transducer measures the pressure drop across the pneumotachygraph connected in series with the open shutter to the airway, which yields airflow ( ). The bottom pressure transducer measures airway pressure (alveolar pressure during no flow, or Palv). During inspiration, the alveolus enlarges by ΔV from the original volume (broken line) to a new volume (solid line); during expiration, the alveolus returns to its original volume. Throughout inspiration, alveolar gas (previously at atmospheric pressure) is subatmospheric and therefore occupies more volume. This is the same as adding this increment of gas volume resulting from decompression of the alveolar gas to the plethysmograph, so Pbox increases and is recorded by the sensitive Pbox transducer. The reverse happens during expiration when alveolar gas is compressed. Thus alveolar pressure can be monitored throughout the respiratory cycle. When
  is plotted against Pbox, the slope of the line (β) yields the ratio of ΔPbox/
 as indicated in the text.
(Modified from Comroe JH Jr, Forster RE II, DuBois AB, et al: The lung: clinical physiology and pulmonary function tests, ed 2, Chicago, 1962, Year Book.)
