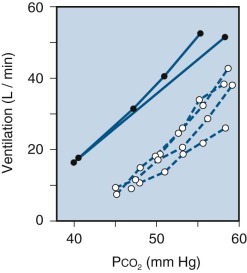
eFigure 25-13.

Comparison of rebreathing and steady-state hypercapnic response curves.
Response lines defined by the steady-state method (solid symbols) and by the rebreathing method (open symbols) are shown for two experiments on the same subject. In one experiment, the steady-state points were defined by inhalation of each of four carbon dioxide mixtures for 20 minutes without intervening periods of air breathing. In the other experiment, the steady-state points were defined by inhalation of each carbon dioxide mixture for 30 minutes, with an intervening rest period of 30 minutes. The figure illustrates a difference in position of the response lines due to a smaller Pco2 gradient between arterial blood and chemoreceptor tissue during the rebreathing method. The close agreement in slope implies that the ratio of change in end-tidal Pco2 to change in chemoreceptor Pco2 is the same in the two methods.
(Modified from Read DJC: A clinical method for assessing the ventilatory response to carbon dioxide. Australas Ann Med 16:20–32, 1967.)
