Figure 1.

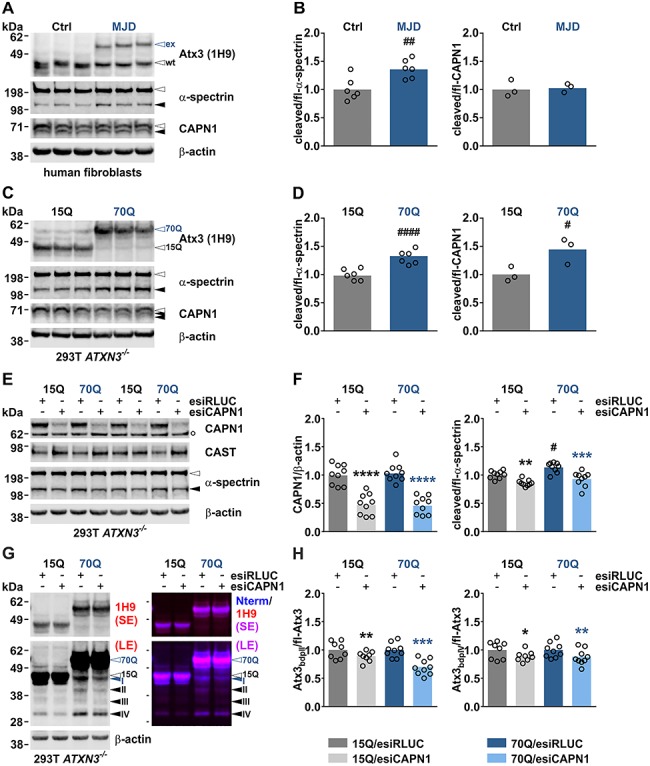
Calpain system overactivation and ataxin-3 cleavage in MJD cell models is lowered by calpain-1 knockdown. (A) Western blot of cleaved α-spectrin and processed calpain-1 in fibroblasts derived from healthy control (Ctrl) subjects and MJD patients. Genotypes were confirmed by detecting ataxin-3. Actin served as a loading control. (B) Densitometric quantification of α-spectrin cleavage (n = 6) and calpain processing (n = 3). #:Ctrl versus MJD; ##P ≤ 0.01; Student’s t-test. (C) Western blot of cleaved α-spectrin and processed calpain-1 in HEK 293T ATXN3−/− cells (293T ATXN3−/−) transfected with V5-tagged ataxin-3 15Q or 70Q. Genotypes were confirmed by detection of ataxin-3. Actin served as a loading control. (D) Densitometric quantification of α-spectrin cleavage (n = 6) and calpain-1 processing (n = 3). #:15Q versus 70Q; #P ≤ 0.05, ####P ≤ 0.0001; Student’s t-test. (E) Western blot of calpain-1, CAST and cleaved α-spectrin in HEK 293T ATXN3−/− cells double transfected with V5-tagged ataxin-3 15Q or 70Q and esiRNA directed against human calpain-1 (esiCAPN1) or control esiRNA against Renilla luciferase (esiRLUC). Actin served as a loading control. (F) Densitometric quantification of calpain-1 levels (n = 9) and α-spectrin cleavage (n = 9). *(black): 15Q/esiRLUC versus 15Q/esiCAPN1, *(blue): 70Q/esiRLUC versus 70Q/esiCAPN1, #:15Q/esiRLUC versus 70Q/esiRLUC; #P ≤ 0.05, **P ≤ 0.01, ***P ≤ 0.001, ****P ≤ 0.0001; one-way ANOVA with Tukey post-test. (G) Western blot analysis of ataxin-3 cleavage in ATXN3−/− cells double transfected with V5-tagged ataxin-3 15Q or 70Q and esiRNA directed against human calpain-1. Ataxin-3 breakdown products (bdp) were detected using antibodies specific against the centre (1H9) or the N-terminus (Nterm) of the protein. Full-length ataxin-3 15Q or 70Q is indicated by black- or blue-lined white arrowheads, respectively. Black arrowheads indicate N-terminal fragments, the blue one a polyQ-containing ataxin-3 breakdown product. Actin served as a loading control. (H) Densitometric quantification of two prominent ataxin-3 fragments bdp II and bdp IV (for both 15Q: n = 8; 70Q: n = 9). Values were normalized to respective controls ataxin-3 15Q/esiRLUC or ataxin-3 70Q/esiRLUC. *(black): 15Q/esiRLUC versus 15Q/esiCAPN1, *(blue): 70Q/esiRLUC versus 70Q/esiCAPN1; *P ≤ 0.05, **P ≤ 0.01, ***P ≤ 0.001; Student’s t-test. White arrowheads indicate full-length proteins, blue and black arrowheads protein fragments. White bullet (°) indicates an unspecific band. Bdp = breakdown product, ex = polyQ-expanded ataxin-3, fl = full-length, LE = long exposure, SE = short exposure, wt = wild-type ataxin-3. Columns represent means.
