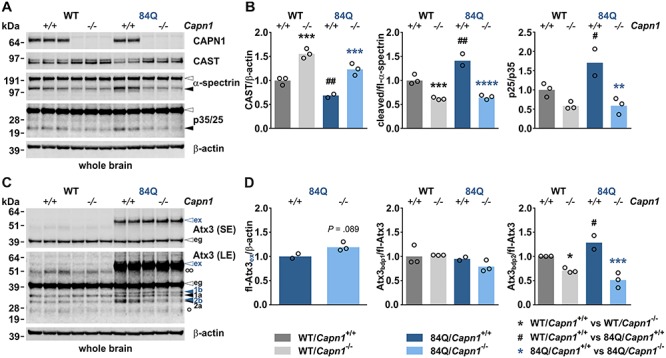
Figure 2.

Calpain-1 knockout in MJD mice lowers calpain system overactivation and cleavage of ataxin-3. (A) Western blot of calpain-1, CAST and substrate proteins α-spectrin and p35 in whole brain of 3-month-old mice. Actin served as a loading control. (B) Densitometric quantification of CAST levels, α-spectrin cleavage and p35-to-p25 conversion (WT/Capn1+/+: n = 3; WT/Capn1−/−: n = 3; 84Q/Capn1+/+: n = 2; 84Q/Capn1−/−: n = 3). *(black): WT/Capn1+/+ versus WT/Capn1−/−, *(blue): 84Q/Capn1+/+ versus 84Q/Capn1−/−, #:WT/Capn1+/+ versus 84Q/Capn1+/+; #P ≤ 0.05, **/##P ≤ 0.01, ***P ≤ 0.001, ****P ≤ 0.0001; one-way ANOVA with Fisher’s LSD post-test. (C) Western blot analysis of ataxin-3 levels and cleavage in whole brain of 3-month-old mice. Ataxin-3 fragmentation was detected using the centre-binding antibody 1H9. Ataxin-3 breakdown products (bdp) are indicated with black and blue arrowheads (labelled with 1a, 1b, 2a and 2b). Blue arrowheads indicate ataxin-3 fragments specifically formed in YAC84Q animals. Actin served as a loading control. (D) Densitometric quantification of full-length polyQ-expanded ataxin-3 and of two prominent ataxin-3 fragments bdp 1 (a and b) and bdp 2 (a and b) (WT/Capn1+/+: n = 3; WT/Capn1−/−: n = 3; 84Q/Capn1+/+: n = 2; 84Q/Capn1−/−: n = 3). *(black): WT/Capn1+/+ versus WT/Capn1−/−, *(blue): 84Q/Capn1+/+ versus 84Q/Capn1−/−, #:WT/Capn1+/+ versus 84Q/Capn1+/+; *,#P ≤ 0.05, ***P ≤ 0.001; Student’s t-test (for full-length polyQ-expanded ataxin-3) and one-way ANOVA with Fisher’s LSD post-test (for all other comparisons). White arrowheads indicate full-length proteins, black arrowheads protein fragments. White bullets indicate heavy (°°) and light (°) IgG chains. eg = endogenous ataxin-3, ex = polyQ-expanded ataxin-3, fl = full-length, LE = long exposure, SE = short exposure. Columns represent means.
