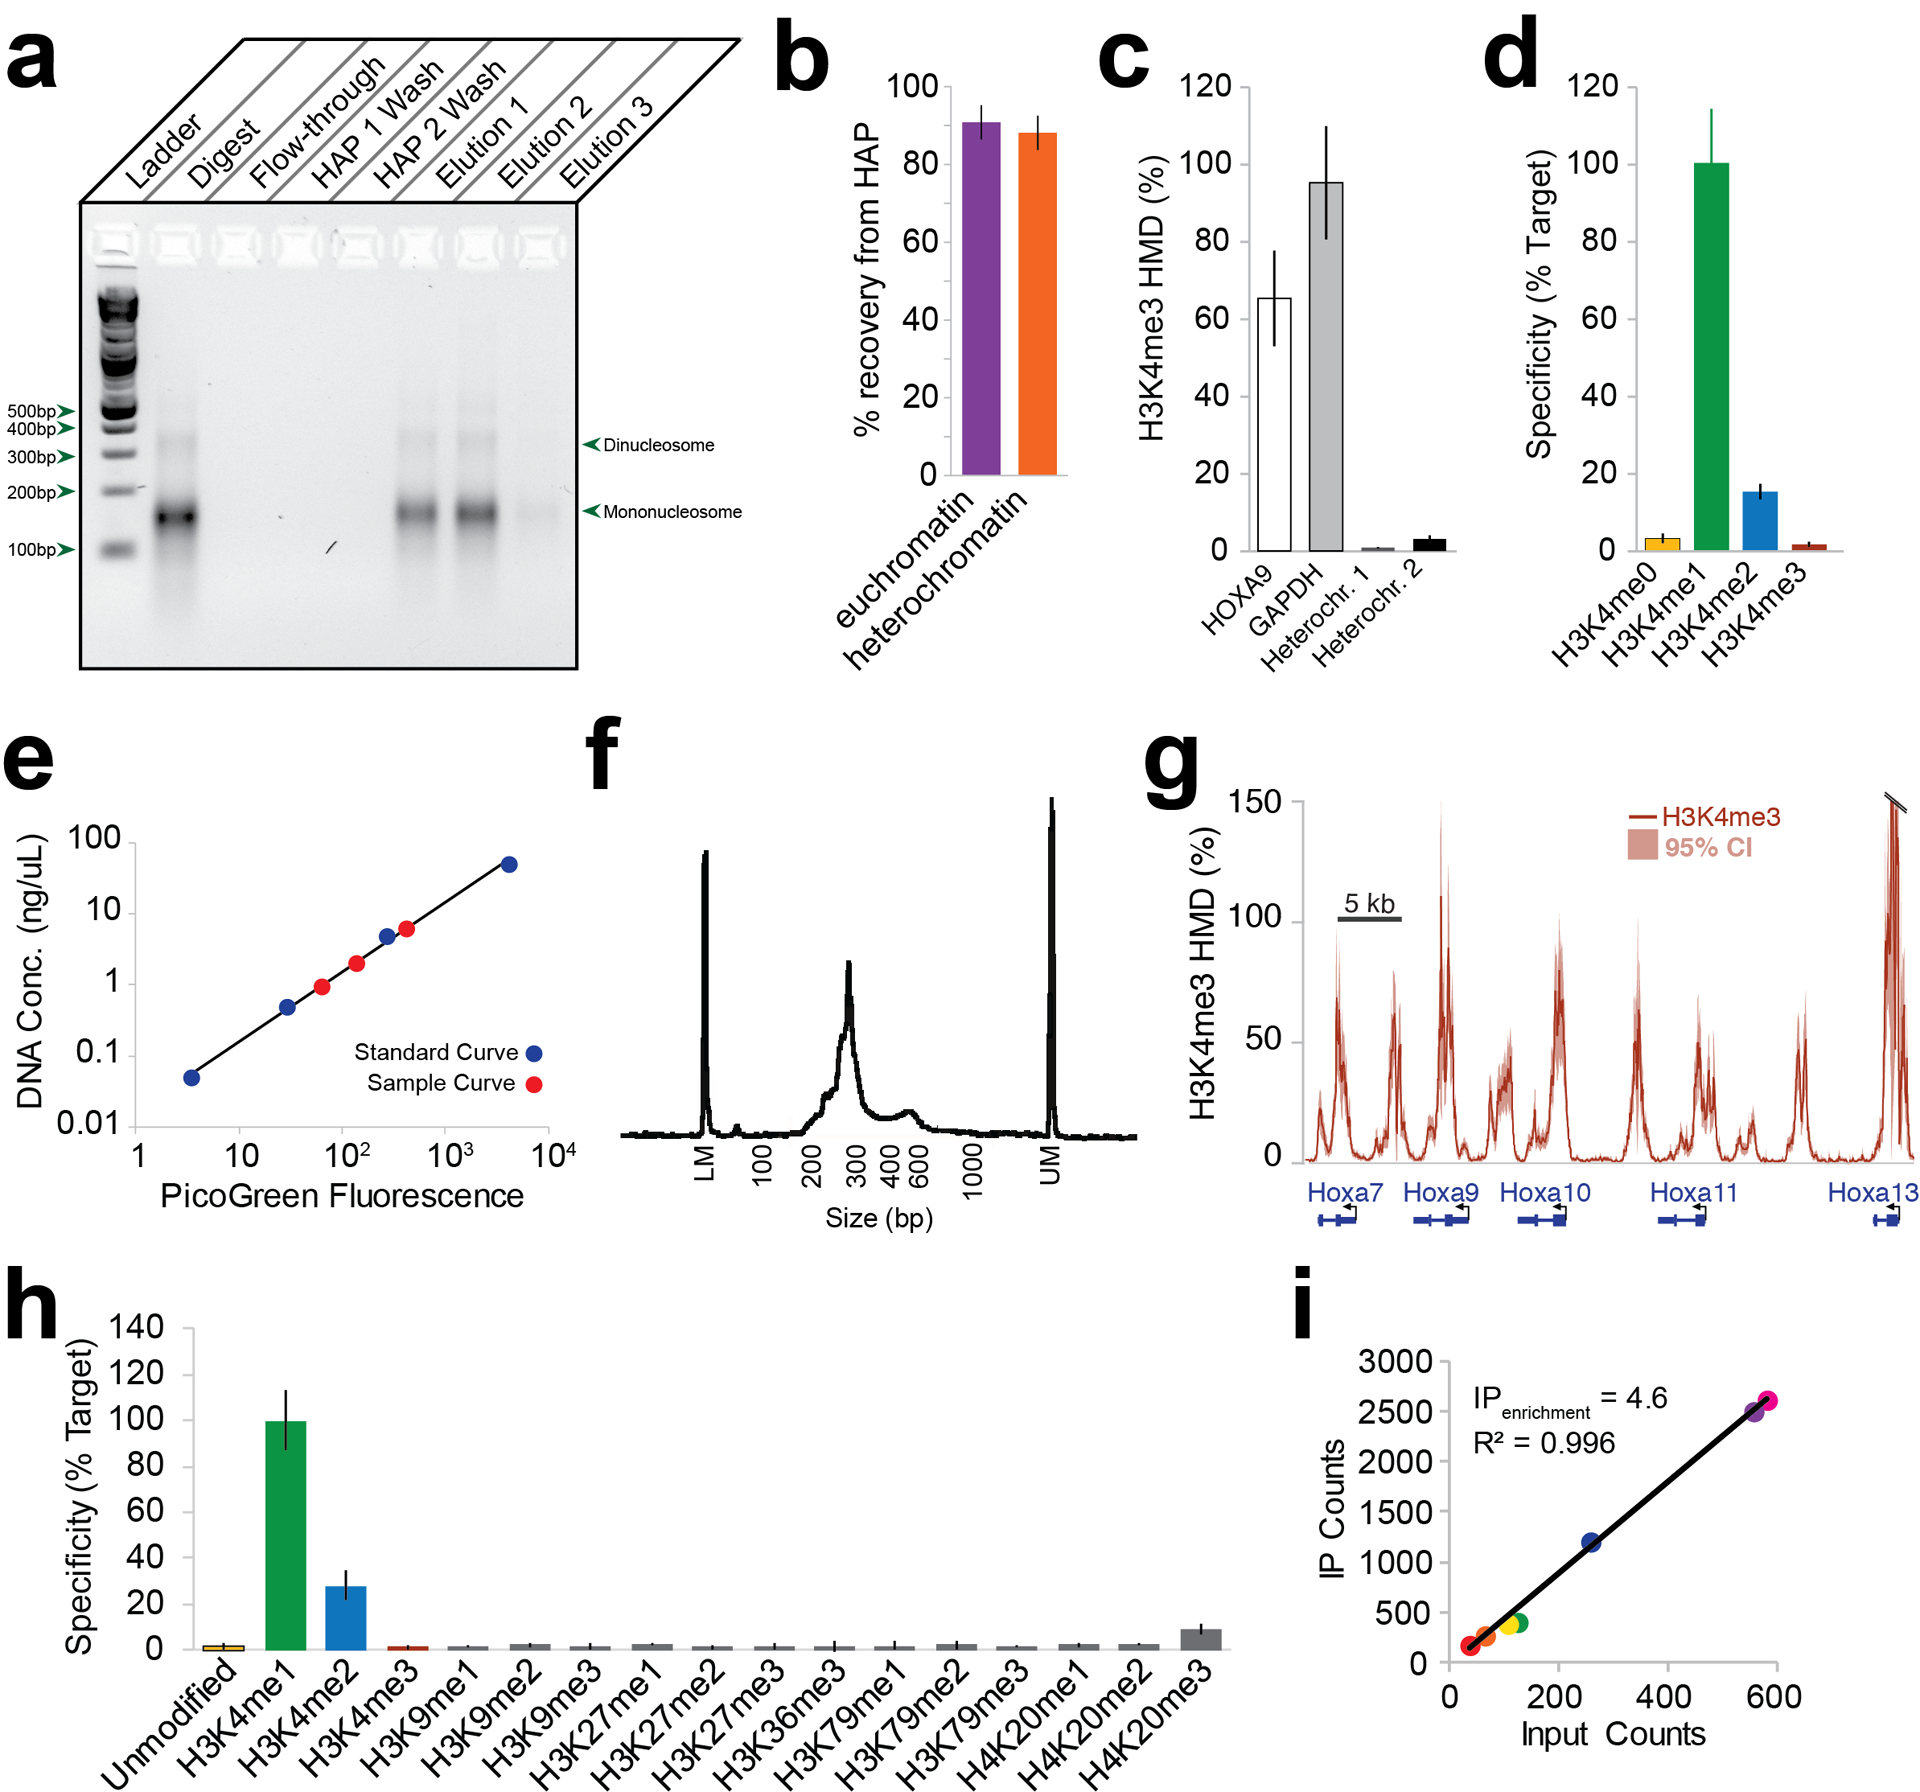
Figure 3 |. Representative results of the ICeChIP procedure.

(a) Agarose gel showing anticipated HAP chromatography purification of native mononucleosomes4. Lanes, from left to right: DNA ladder, pooled digested elutions (Step 35), flow-through of binding resin (Step 31), pooled HAP Buffer 1 washes (Step 32), pooled HAP Buffer 2 washes (Step 33), HAP Elution #1 (Step 34), HAP Elution #2 (Step 34), and HAP Elution #3 (Step 34). The gel shows a largely mononucleosome-sized distribution of DNA in the elutions (pooled and individual) and no detectable DNA in the flow-through of resin or the washes. (b) Recovery of chromatin from HAP chromatography measured with euchromatin- and heterochromatin-specific primers. The euchromatic and heterochromatic nucleosomes are recovered in highly similar proportions. (c) H3K4me3 histone modification density measurements at four loci by qPCR. Error bars represent standard deviation of three qPCR measurements from one ICeChIP experiment. The samples all show HMDs between 0–100%, and there is greater H3K4me3 HMD at gene promoters (HOXA9, GAPDH) than at heterochromatic regions. (d) Specificity of anti-H3K4me1 antibody measured by qPCR. Black error bars represent standard deviation of replicates. Colored error bar shows qPCR standard deviation as percent of target. The binding of the antibody to off-target species is small compared to binding of antibody to the target, indicating that this is a high-specificity antibody. (e) Example of PicoGreen DNA quantification with both calibration curve (blue) and sample quantification curve (red). The calibration curve can be used to measure the DNA concentrations of the samples and spans a greater range of concentrations than do the samples. (f) Bioanalyzer capillary electrophoresis trace of appropriately-sized NGS IP library. This trace shows a peak largely between 200–350 bp, corresponding to a mononucleosome-sized insert (after adapter ligation, accounting for the greater size of the fragment). (g) H3K4me3 HMD genomic browser view from E14 mESCs. Shaded bars represent 95% confidence interval about HMD; solid line represents HMD measurement. The genome-browser view shows biologically meaningful HMDs between 0–100%, with peaks at genic regions, as expected for this modification. (h) Full specificity panel in NGS of H3K4me1 ICeChIP. Error bars represent standard deviation of enrichment of ladder members. The antibody shows high specificity (i.e. low binding to off-target modifications relative to the target), as anticipated from the ICeChIP-qPCR specificity testing in Fig. 3d. (i) Example of IP vs. Input count scatterplot from ICeChIP-seq, showing linearity of IP for H3K4me1 ladder. The scatterplot shows high linear correlation between the number of reads in the IP and the number of reads in the input for this given modification, which is expected. Panels (b), (c), and (g) adapted from Grzybowski et al.43 using AM39159 in E14 mESCs; panels (d) and (h) adapted from Shah et al.45 using EPG A-4031–050, Lot 606359. Panel (i) based on reanalysis of sequencing data accompanying Shah et al.45 using EPG A-4031–050, Lot 606359.
