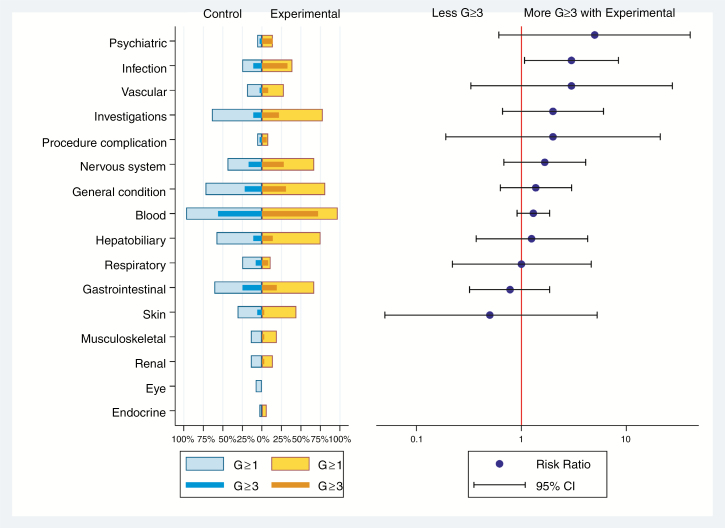
Fig. 3.
Butterfly plot of adverse events (related or not) in the 2 groups by system organ class. The panel on the left is a butterfly plot showing the proportion of patients experiencing an adverse event coded as related or not to the study treatment, whatever the grade (light blue for control group and yellow for experimental group), and a severe adverse event, grade ≥3 (dark blue for control group and orange for experimental group) according to group of randomization. The panel on the right displays the relative risk of a severe adverse event in patients in the experimental group relative to patients in the control group, with 95% CI. The toxicity items were pooled by system organ class. Details of adverse events are given in Supplementary Table 13.

