Fig. 1.
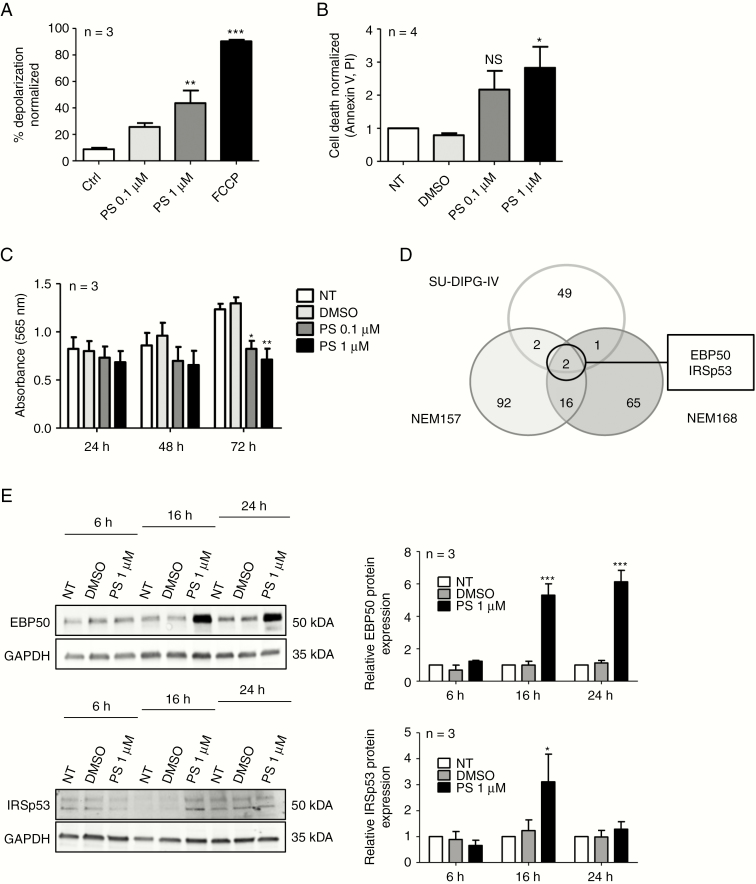
Panobinostat treatment effects in DMG cell lines. (A) BH3 profiling of NEM157 cells at 90 minutes. Mitochondrial depolarization was measured with fluorescent dye JC-1, 16 hours after DMSO (solvent) or PS treatment. Data were normalized to DMSO. Ctrl: DMSO; FCCP (carbonyl cyanide-4-(trifluoromethoxy)phenylhydrazone) : positive control. (B) NEM157 cell death was measured by FACS using annexin-V–fluorescein isothiocyanate /PI staining 72 hours after treatment. Data were normalized to not-treated cells. (C) NEM157 cell growth was measured by absorbance at different timepoints using a sulforhodamine B assay. (D) Venn diagram resuming number of deregulated proteins (P < 0.05; fold change >1.5 or <0.7) after PS treatment on indicated cell lines. (E) Western blot validation of EBP50 and IRSp53 protein expression at different timepoints in NEM157 cells. Graphs were normalized to glyceraldehyde 3-phosphate dehydrogenase. NT: not treated.

