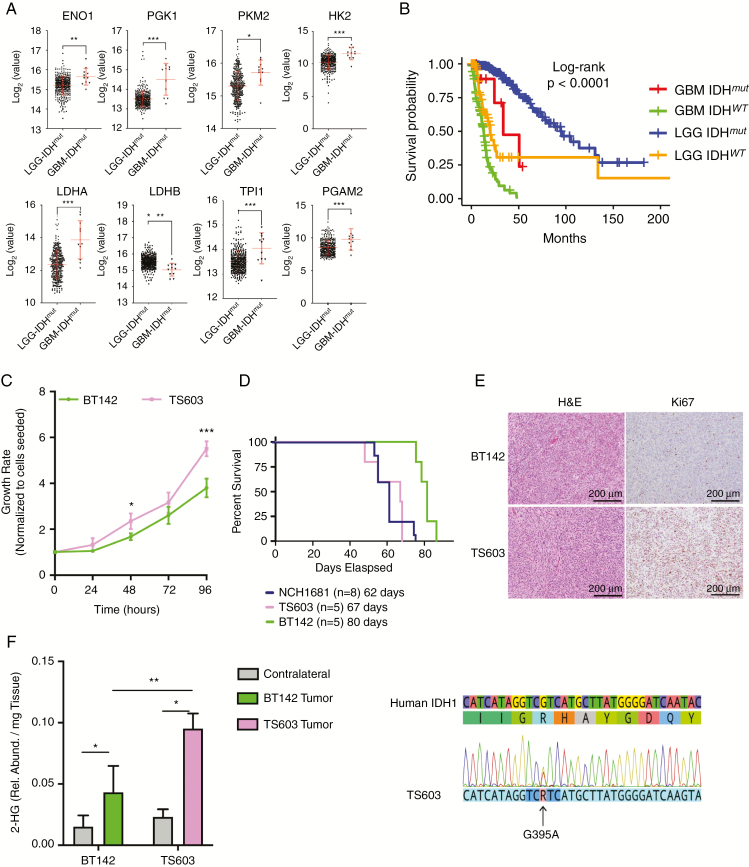
Fig. 1.
Identification of model systems that reflect patient’s LGG and secondary GBM glycolytic phenotype. (A) mRNA levels comparison between LGGs (circles, n = 369) and secondary GBM (triangles, n = 11) containing an IDHmut. The y-axes are displayed as log2 from the mRNA counts, including the mean and SD in red. FDR corrected P-values obtained from a t-test, *P < 0.05; **P < 0.005; ***P < 0.001. A detailed version of the fold change and p-values is located in the Supplementary Table. (B) Kaplan–Meier survival plot generated from TCGA data stratified according to the grade and IDH mutational status. Blue: IDHmut LGG patients. Red: secondary IDHmut GBM patients. Orange: IDHwt LGG patients. Green: IDHwt GBM. (C) Growth rate of TS603 ND BT142 over time. (D) Kaplan–Meier survival plot for mice inoculated with IDH1mut cell lines. (E) 2HG levels in both the tumor and contralateral tissue obtained from mice inoculated with IDH1mut cell lines. (F) Immunostaining of tissue collected from our IDH1mut mouse models displaying both hematoxylin and eosin and Ki67 as a marker of proliferation. Scale bars and percentage of staining are provided within the images. Significance based on t-test for 2HG levels and growth rate. *P < 0.05; **P < 0.005; ***P < 0.001.

