Fig. 2.
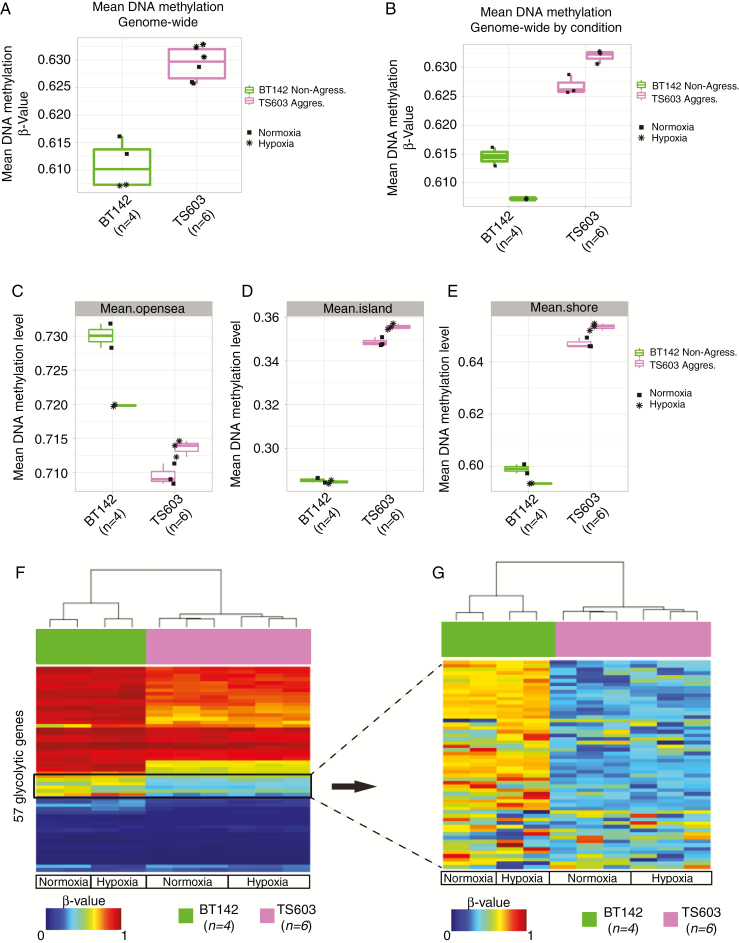
Aggressive IDH1mut cell line maintains higher genome-wide methylation but displays lower methylation in the promoter region of the glycolytic genes. (A, B) Boxplot of the genome-wide DNA methylation levels between 2 different IDH1mut cell lines under normoxia and hypoxia in vitro. The y-axis indicates mean DNA methylation beta-values. Key is provided to indicate cell type and condition. (C, D, E) Boxplots of the DNA methylation levels for the different regions where the probes are located. (F) Heatmap of DNA methylation. Column-wise represents IDH1mut glioma cell line samples, row-wise represents 57 probes from the glycolytic genes. (G) Zoom in of the heatmap of DNA methylation for the IDH1mut cell lines for the region where the differential methylated probes are located within the glycolytic gene set.

