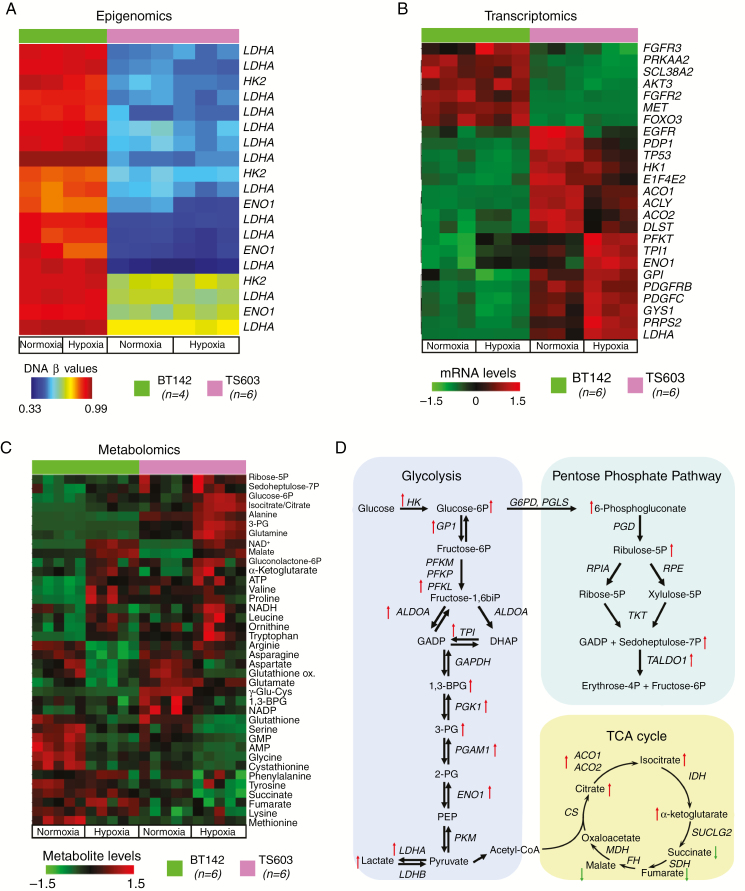
Fig. 3.
Multi-omics approach to identify the mechanisms associated with aggressive phenotype in IDH1mut glioma cells. (A) Epigenomic analysis showing differentially methylated promoter regions for the glycolysis and PPP pathways between the aggressive (pink) and non-aggressive (green) IDH1mut cell lines. (B) Transcriptomics approach to identify differentially regulated mRNA transcripts out of 180 probes. Similar color coding as (A). Top 25 mRNAs as selected by their FDR-corrected P-values are displayed. (C) Metabolomics analysis for the relative quantification of metabolites from glycolysis, PPP, amino acids, energy, and TCA cycle. (D) Schematic representation of the enzymatic reactions from glycolysis, PPP, and TCA cycle highlighting the changes at the mRNA and metabolite levels between the 2 cell lines.

