Fig. 1.
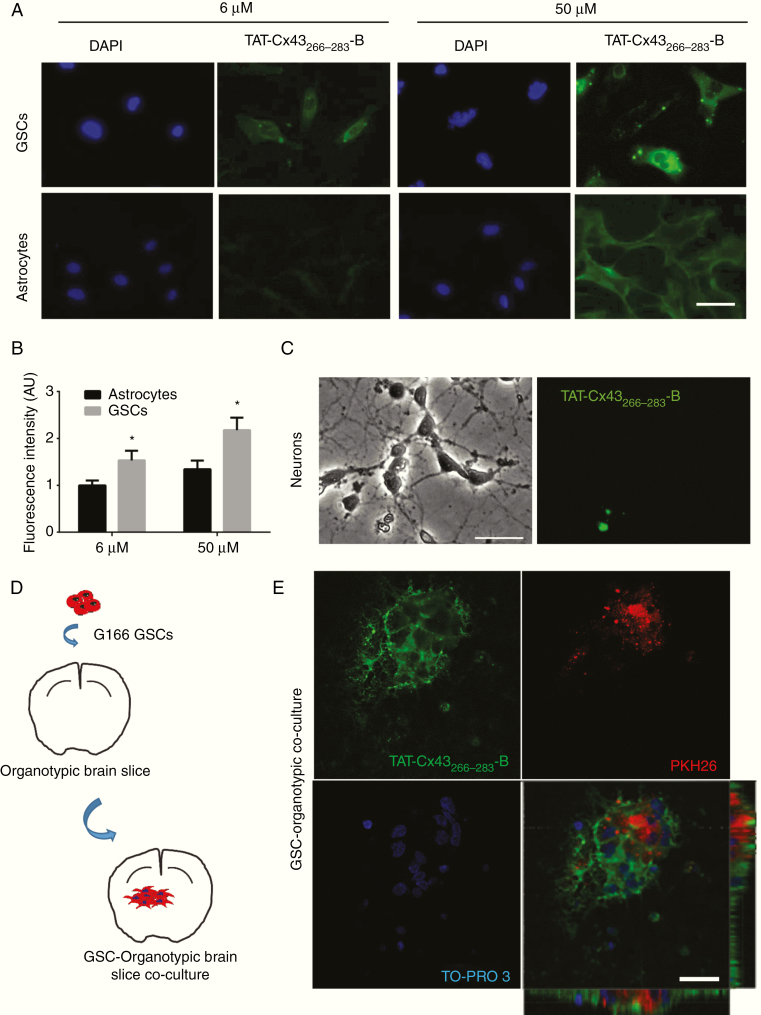
TAT-Cx43266–283 internalization in GSCs, neurons, and astrocytes. (A–C) Cells incubated with TAT-Cx43266–283 fused to biotin at the C-terminus (TAT-Cx43266–283-B) for 5 min and revealed with streptavidin. TAT-Cx43266–283 (green) and DAPI (blue) staining of the same field. (A) Internalization of 6 and 50 µM TAT-Cx43266–283-B in GSCs and astrocytes. Bar: 100 µm. (B) Quantification of TAT-Cx43266–283-B fluorescence expressed as arbitrary units (AU) and the mean ± SEM of 3 independent experiments (t-test: *P < 0.05). (C) Images from the same field showing the lack of internalization in neurons incubated with 50 µM of TAT-Cx43266–283-B for 5 min. Bar: 50 µm. (D) Scheme for GSC–organotypic brain slice cocultures. (E) Cocultures incubated with 50 µM TAT-Cx43266–283-B for 5 min. TAT-Cx43266–283-B internalization (green) in GSCs (PKH26 [red]) and surrounding cells (nuclear staining, TO-PRO-3 [blue]). Bar: 25 µm. See also Supplementary Movie 1 showing the complete Z-stack.

