Fig. 3.
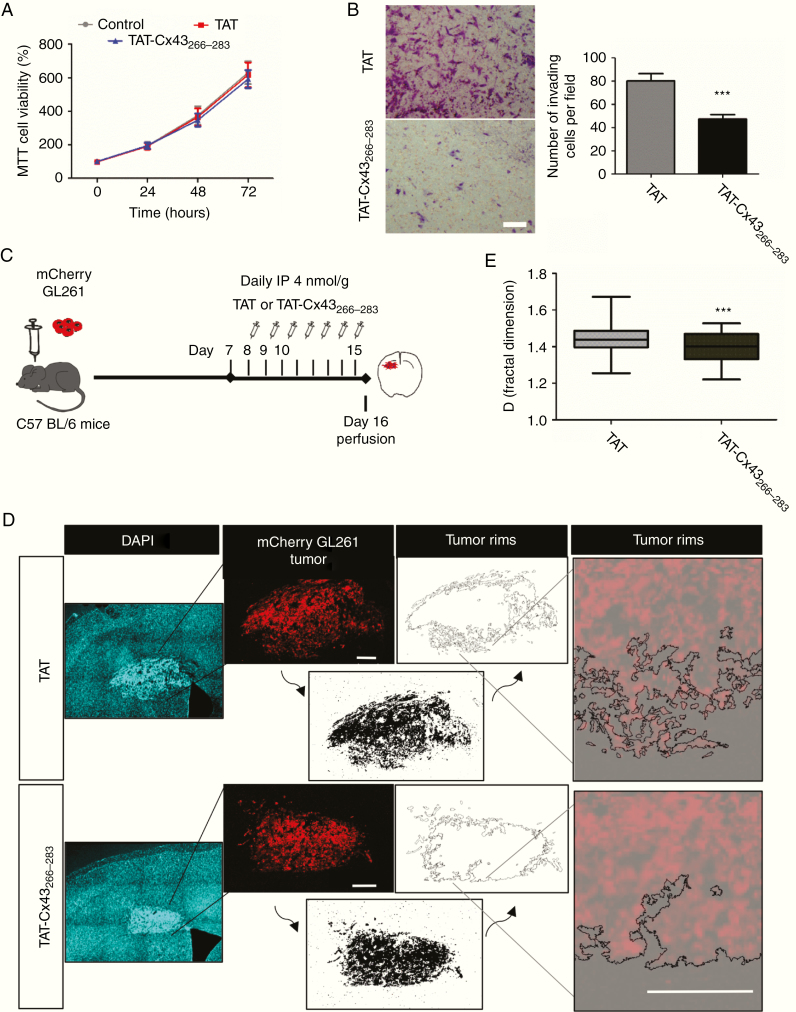
TAT-Cx43266–283 reduces the invasion of GL261 glioma cells in vivo. (A) MTT of GL261 cells incubated with 100 µM TAT or TAT-Cx43266–283. Percentage of the control (mean ± SEM; n = 3; ANOVA). (B) Matrigel invasion assay. GL261 cells were treated with 100 µM TAT or TAT-Cx43266–283 for 15 h. Representative images of the inserts and quantification. Bar: 100 µm; mean ± SEM; n = 3 (Student’s t-test: ***P < 0.001). (C) GL261 cells were intracranially implanted in syngeneic mice (C57BL/6) and allowed to grow for 7 days. Then, a daily i.p. injection of 4 nmol/g TAT or TAT-Cx43266–283 was administered for the next 7 days. (D) Mosaic immunofluorescence of DAPI (blue), mCherry GL261 glioma cells (red), the thresholded images (bottom, black), the tumor rims (top), and their magnifications. Bars: 200 µm. (E) The box plot shows the fractal dimension (D) of the tumor rims. D was determined in at least 3 separate sections per animal in 12 TAT and 13 TAT-Cx43266–283 animals from 4 independent experiments. The band inside the box represents the median and the bottom and top of the box represent the first and third quartiles. The top and bottom whiskers reflect the minimum and maximum values, respectively (Student’s t-test: ***P < 0.001).

