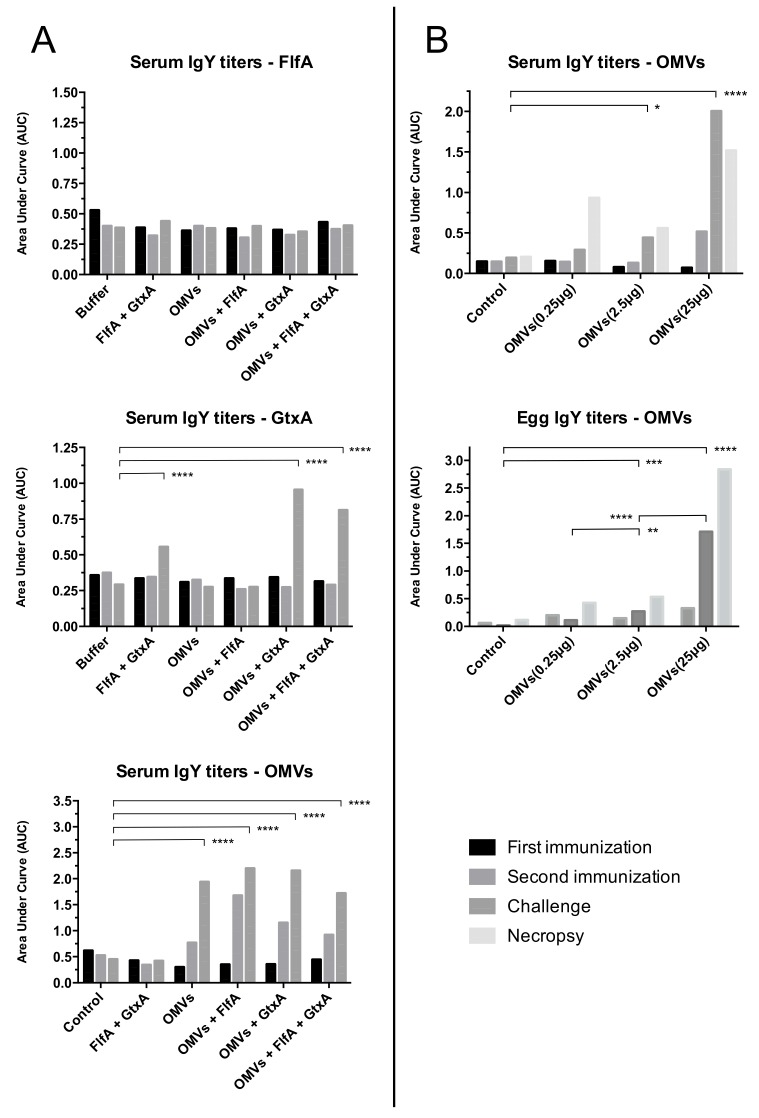
Figure 5.
IgY response to immunization. Sera and yolk IgY from study 1 (A) and 2 (B) were pooled together within each individual group and analyzed for IgY response against FlfA, GtxA-N and G. anatis OMVs. Data are reported as the area under curve (AUC), calculated from ELISA titration curves. Four time points are shown: first immunization (T0); second immunization (T1); challenge (T2); necropsy (T3). *: p < 0.05; **: p < 0.01; ***: p < 0.001; ****: p < 0.0001. p values from Dunnett’s multiple comparison test shown (alpha = 0.05).

