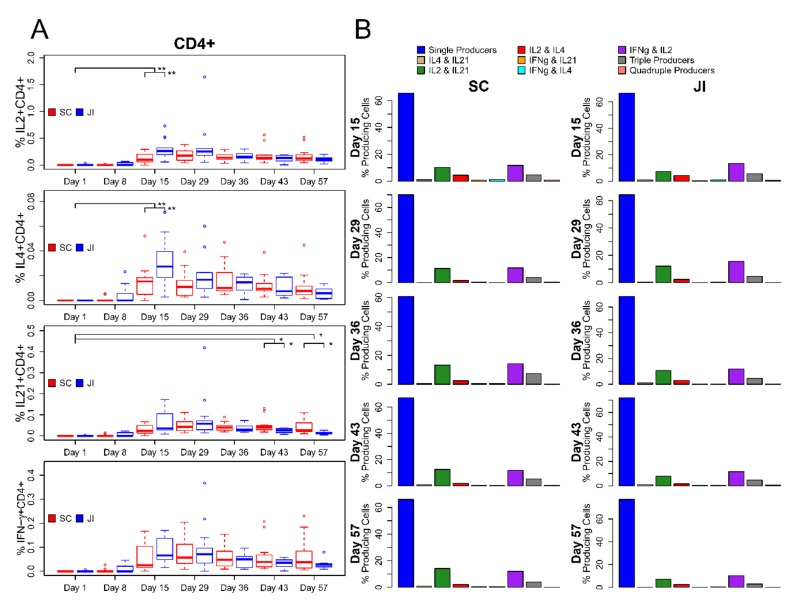
Figure 3.
Changes in CD4+ T cell response by Treatment Arm and Polyfunctional Cytokine Response. (A). Boxplots of percent cytokine-expressing cells over time by treatment group. (B) Bar charts summarizing cytokine expression over time by treatment group. Vertical black lines indicate statistical significance based on Wilcoxon rank-sum test. *: p < 0.05, **: p < 0.01. Vertical lines that connect to Day 1 compare the difference in percent post- vs. pre-vaccination between treatment groups. Lines that connect treatment groups within time point compare percentages for that respective visit.

