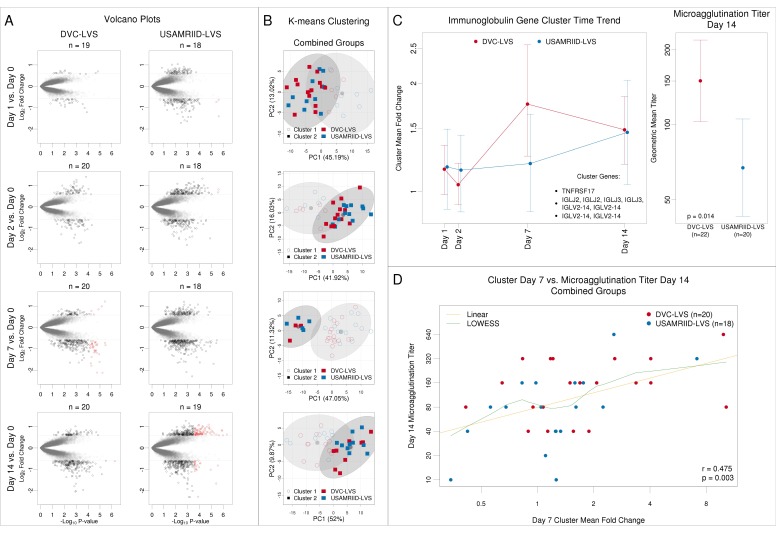
Figure 2.
DVC-LVS and USAMRIID-LVS tularemia vaccine lots induce similar transcriptomic response profiles. (A) Volcano plots for the DVC-LVS (column 1) or USAMRIID-LVS (column 2) group contrasting the log10 p-value by log2 fold change from pre-vaccination (red = DEGs, FDR p-value ≤ 0.05; black = genes with ≥1.5-fold change; grey = genes with <1.5-fold change). 43 genes in the DVC-LVS and 107 in the USAMRIID-LVS were found to be differentially expressed for one but not the other vaccine lot but the directionality was similar. (B) K-means clustering analysis of log2-fold changes of genes that were differentially expressed in either vaccine group for any post-vaccination day showed clustering of both tularemia vaccine lots together. K-means clustering (colored squares) is overlaid on principal component biplot clusters (empty circles). (C) Fold changes for co-expressed genes that were significantly differentially regulated in the DVC-LVS group at day 7 are compared to USAMRIID at Day 7 (46% increase in DVC group). All genes had similar regulation at Days 1, 2, and 14. On the right panel, microagglutination antibody assay titers with associated 95% confidence intervals at Day 14 for the two groups (p = 0.014). (D) Scatterplot of mean cluster fold change in genes at Day 7 versus log2 microagglutination antibody assay titer at Day 14 (green line: locally weighted scatterplot smoothing fit; yellow line: linear fit).

