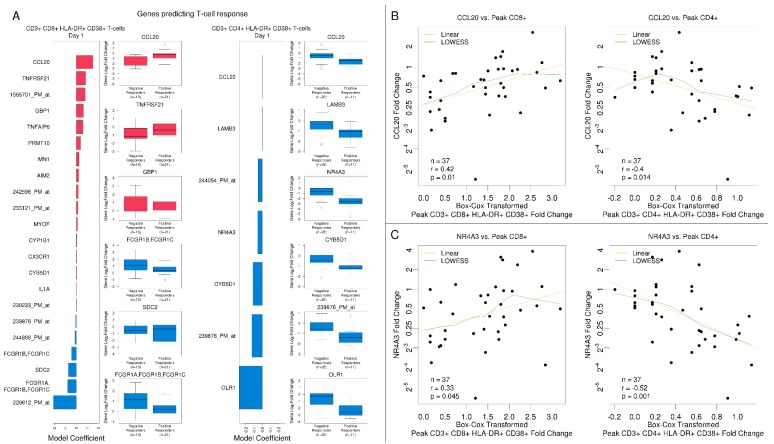
Figure 7.
Select immune-related gene responses at Day 1 predicted T-cell responses to the tularemia vaccine. (A) The bar plots represent regularized linear regression coefficients of the best model for predicting a positive CD8+ response (to the left) and positive CD4+ T cell response (to the right). Boxplots for the top (red) and bottom-ranked genes (blue) with annotations based on the logistic regression coefficient are presented. (B,C) Scatterplots that summarize individual gene associations between peak CD4+ and CD8+ and gene log2 fold change for the CCL20 and NR4A3 genes (green lines) including locally weighted scatterplot smoothing trend lines (yellow lines). CCL20 and NR4A3 were notably negatively correlated with CD4+ T cell responses and positively correlated with CD8+ responses.

