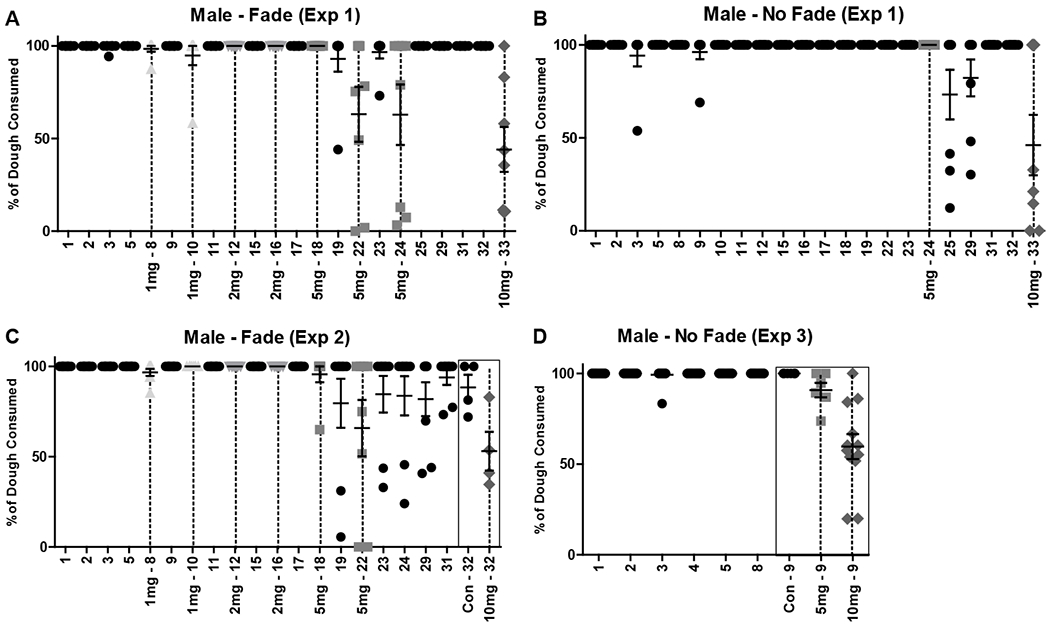
Figure 2.

Timeline and dough consumption in male mice (mean ± SEM) for A) Experiment 1 Fade condition (n = 8), B) Experiment 1 No Fade condition (n = 8), C) Experiment 2 Fade condition (n = 8), and D) Experiment 3 No Fade condition (n’s = 6-12). % of dough consumed was calculated by subtracting leftover, post-consumption dough weight from initial dough serving weight. Dough access was 60-120 minutes on days 1 and 2 and 30 minutes on all other days. X-axis indicates experimental day and THC dose provided in mg (per kg). Black circles = control dough. Gray shapes (unique per dose) and dashed vertical lines = THC dough. Black boxes in (C/D) indicate a difference in THC dose provided between subjects.
