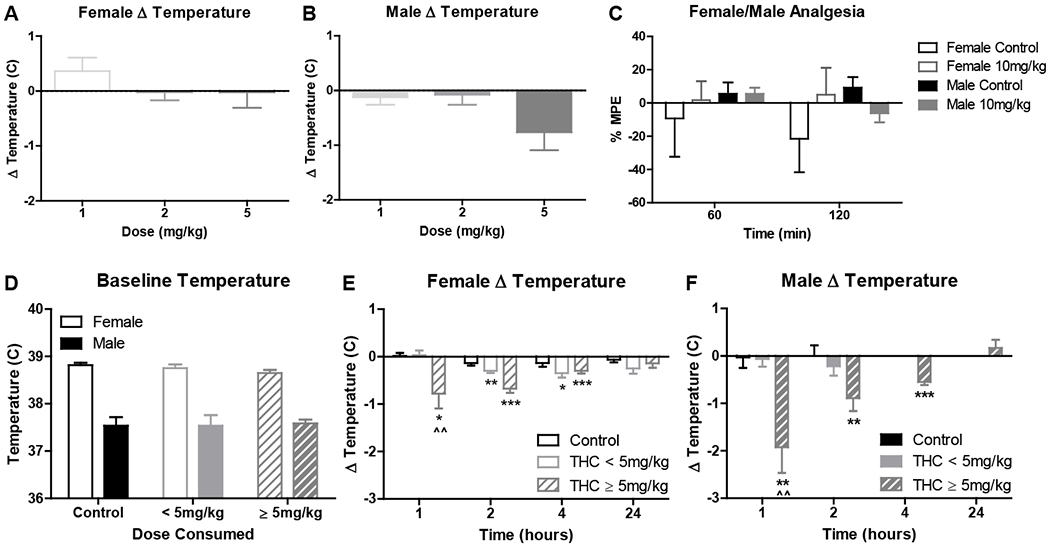
Figure 7.

A/B) Body temperature and C) analgesia for all mice following repeated THC consumption in Experiment 2 (mean ± SEM). Average change in body temperature following control dough consumption in A) female or B) male mice in the Fade condition provided 1, 2, and 5 mg/kg THC doses (n’s = 8). C) % MPE across days 31-32 in mice in the Fade condition at 60 and 120 minutes following 10 mg/kg THC or control dough access (n’s = 4). D/E/F) Body temperature for all mice following acute THC consumption in Experiment 3 (mean ± SEM). D) Day 8 baseline body temperature following control dough consumption, grouped by THC dose consumed the following day, and day 9 change in body temperature in control, low- (THC < 5 mg/kg), and high- (THC ≥ 5 mg/kg) consuming E) female or F) male mice in the No Fade condition (n’s = 6-12). ^^p < .01 vs control; *p < .05, **p < .01, ***p < .001 vs 0°C.
